Quantcast
Channel: partitions – Cloud Data Architect
Viewing all 413 articles
Browse latest View live

MIN/MAX Optimization and Asynchronous Global Index Maintenance

$
0
0

Feed: Striving for Optimal Performance.

In this short post I would like to point out a non-obvious issue that one of my customers recently hit. On the one hand, it’s a typical case where the query optimizer generates a different (suboptimal) execution plan even though nothing relevant (of course, at first sight only) was changed. On the other hand, in this case after some time the query optimizer automatically gets back to the original (optimal) execution plan.

Let’s have a look at the issue with the help of a test case…

The test case is based on a range partitioned table:

CREATE TABLE t
PARTITION BY RANGE (d) 
(
  PARTITION t_q1_2019 VALUES LESS THAN (to_date('2019-04-01','yyyy-mm-dd')),
  PARTITION t_q2_2019 VALUES LESS THAN (to_date('2019-07-01','yyyy-mm-dd')),
  PARTITION t_q3_2019 VALUES LESS THAN (to_date('2019-10-01','yyyy-mm-dd')),
  PARTITION t_q4_2019 VALUES LESS THAN (to_date('2020-01-01','yyyy-mm-dd'))
)
AS
SELECT rownum AS n, to_date('2019-01-01','yyyy-mm-dd') + rownum/(1E5/364) AS d, rpad('*',10,'*') AS p
FROM dual
CONNECT BY level 

The partitioned table has a global partitioned index (but the behaviour would be the same with a non-partitioned index):

CREATE INDEX i ON T (n) GLOBAL PARTITION BY HASH (n) PARTITIONS 16

The query hitting the issue contains a MIN (or MAX) function:

SELECT min(n) FROM t

Its execution plan is the following and, as expected, uses the MIN/MAX optimization:

--------------------------------------------
| Id  | Operation                   | Name |
--------------------------------------------
|   0 | SELECT STATEMENT            |      |
|   1 |  SORT AGGREGATE             |      |
|   2 |   PARTITION HASH ALL        |      |
|   3 |    INDEX FULL SCAN (MIN/MAX)| I    |
--------------------------------------------

One day the data stored in the oldest partition is no longer needed and, therefore, it’s dropped (a truncate would lead to the same behaviour). Note that to avoid the invalidation of the index, the UPDATE INDEXES clause is added:

ALTER TABLE t DROP PARTITION t_q1_2019 UPDATE INDEXES

After that operation the query optimizer generates another (suboptimal) execution plan. The index, since it’s valid, it’s used. But, the MIN/MAX optimization is not:

---------------------------------------
| Id  | Operation              | Name |
---------------------------------------
|   0 | SELECT STATEMENT       |      |
|   1 |  SORT AGGREGATE        |      |
|   2 |   PARTITION HASH ALL   |      |
|   3 |    INDEX FAST FULL SCAN| I    |
---------------------------------------

And, even worse (?), few hours later the query optimizer gets back to the original (optimal) execution plan.

The issue is caused by the fact that, as of version 12.1.0.1, Oracle Database optimizes the way DROP/TRUNCATE PARTITION statements that use the UPDATE INDEXES clause are carried out. The index maintenance, to make the DROP/TRUNCATE PARTITION statements faster, is delayed and decoupled from the execution of the DDL statement itself. It’s done asynchronously. For detailed information about that feature have a look to the documentation.

To avoid the issue, you have to make sure to immediately carry out the index maintenance after the execution of the DROP/TRUNCATE PARTITION statement. For that purpose, you can run the following SQL statement:

execute dbms_part.cleanup_gidx(user, 'T')

In summary, even though an index is valid and can be used by some row source operations, if it contains orphaned index entries caused by the asynchronously maintenance of global indexes, it cannot be used by INDEX FULL SCAN (MIN/MAX). A final remark, the same is not true for the INDEX RANGE SCAN (MIN/MAX). In fact, that row source operation can be carried out also in case orphaned index entries exist.


MySQL Functional Index and use cases.

$
0
0

Feed: Planet MySQL
;
Author: MyDBOPS
;

MySQL has introduced the concept of functional index in MySQL 8.0.13. It is one of the much needed feature for query optimisation , we have seen about histogram in my last blog. Let us explore the functional index and its use cases.

For the below explanation, I have used a production scenario which has 16 core cpu, 32GB RAM and with MySQL version 8.0.16(Latest at the time of writing).

MySQL do support indexing on columns or prefixes of column values (length).

Example: 

mysql>show create table app_userG
*************************** 1. row ***************************
Table: app_user
Create Table: CREATE TABLE `app_user` (
`id` int(11) NOT NULL AUTO_INCREMENT,
`ad_id` int(11) DEFAULT NULL,
`source` varchar(32) DEFAULT NULL,
`medium` varchar(32) DEFAULT NULL,
`campaign` varchar(32) DEFAULT NULL,
`timestamp` varchar(32) DEFAULT NULL,
`createdOn` datetime DEFAULT CURRENT_TIMESTAMP,
PRIMARY KEY (`id`),
KEY `idx_source` (`source`), -------> Index on Column
KEY `idx_medium` (`medium`(5)) -----> Index on Column Prefix
) ENGINE=InnoDB AUTO_INCREMENT=9349478 DEFAULT CHARSET=latin1
1 row in set (0.00 sec)

In MySQL 5.7, We can create an index on generated columns (Computed based on Expressions)

From MySQL 8.0.13, It is even easier by using the feature Functional Indexing. It is also implemented as a hidden virtual column. It inherits all restrictions that apply to generated columns,

Let’s see how it can ease DBA’s life.

The app_user’s table has around 9M records and data from Sep 2018.

mysql>select count(*) from app_user;
+----------+
| count(*) |
+----------+
| 9280573  |
+----------+
1 row in set (1.96 sec)

mysql>select * from app_user limit 1G
*************************** 1. row ***************************
id: 1
ad_id: 787977
source: google-play
medium: organic
campaign:
timestamp: 2018-09-04T17:39:16+05:30
createdOn: 2018-09-04 12:09:20
1 row in set (0.00 sec)

Now Let us consider a case to query the records which are created in the month of May. I have used  pager md5sum for easier result verification.

mysql>pager md5sum
PAGER set to 'md5sum'
mysql>select * from app_user where month(createdOn)=5;
7e9e2b7bc2e9bde15504f6c5658458ab -
74322 rows in set (5.01 sec)

It took 5 seconds to fetch 74322 records. Here is the explain plan for the above query

mysql>explain select * from app_user where month(createdOn)=5G
*************************** 1. row ***************************
id: 1
select_type: SIMPLE
table: app_user
partitions: NULL
type: ALL
possible_keys: NULL
key: NULL
key_len: NULL
ref: NULL
rows: 9176706
filtered: 100.00
Extra: Using where
1 row in set, 1 warning (0.00 sec)

No index is used. Let us try adding an index on column createdOn to speed up this query.

mysql>alter table app_user add index idx_createdon(createdOn);
Query OK, 0 rows affected (44.55 sec)
Records: 0 Duplicates: 0 Warnings: 0

Here is the explain plan post indexing

mysql>explain select * from app_user where month(createdOn)=5G
*************************** 1. row ***************************
id: 1
select_type: SIMPLE
table: app_user
partitions: NULL
type: ALL
possible_keys: NULL
key: NULL
key_len: NULL
ref: NULL
rows: 9176706
filtered: 100.00
Extra: Using where
1 row in set, 1 warning (0.01 sec)

Even after adding index, it goes for full table scan (Indexing is not used) because we are using month() function in WHERE clause it masks the index usage. And there is no improvement in query performance. 

mysql> select * from app_user where month(createdOn)=5;
7e9e2b7bc2e9bde15504f6c5658458ab -
74322 rows in set (5.01 sec)

In this case, we need to rewrite the query replacing the date functions to use the index or else we can create a virtual column for the functional column in where clause of the query and create an index on top of it. But in MySQL 8.0, it makes our work even Simpler. We can create a functional index.

mysql>alter table app_user add index idx_month_createdon((month(createdOn)));
Query OK, 0 rows affected (1 min 17.37 sec)
Records: 0 Duplicates: 0 Warnings: 0
mysql>explain select * from app_user where month(createdOn)=5G
*************************** 1. row ***************************
id: 1
select_type: SIMPLE
table: app_user
partitions: NULL
type: ref
possible_keys: idx_month_createdon
key: idx_month_createdon
key_len: 5
ref: const
rows: 1
filtered: 100.00
Extra: NULL
1 row in set, 1 warning (0.00 sec)

Now it is using an optimal (functional) index and query execution time is also reduced significantly.

mysql>select * from app_user where month(createdOn)=5;
7e9e2b7bc2e9bde15504f6c5658458ab -
74322 rows in set (0.29 sec)

But there are a few restrictions on creating a functional index.

 1) Only functions permitted for generated columns(5.7) are permitted for functional key parts.

2) Primary key cannot be included in functional key parts.

3) Spatial and full text indexes cannot have functional key parts

To drop the columns containing functional index, we need to remove index first before dropping the column else it will throw an error.

Let us try to drop the column createdOn (contains functional index).

mysql> alter table app_user drop column createdOn;
ERROR 3755 (HY000): Cannot drop column 'createdOn' because it is used by a functional index. In order to drop the column, you must remove the functional index.

The functional index is an interesting feature in MySQL 8.0 and a must to tried out by DBA’s.

Featured Image Courtesy Photo by Antoine Dautry on Unsplash

Advertisements

Loading ongoing data lake changes with AWS DMS and AWS Glue

$
0
0

Feed: AWS Big Data Blog.

Building a data lake on Amazon S3 provides an organization with countless benefits. It allows you to access diverse data sources, determine unique relationships, build AI/ML models to provide customized customer experiences, and accelerate the curation of new datasets for consumption. However, capturing and loading continuously changing updates from operational data stores—whether on-premises or on AWS—into a data lake can be time-consuming and difficult to manage.

The following post demonstrates how to deploy a solution that loads ongoing changes from popular database sources—such as Oracle, SQL Server, PostgreSQL, and MySQL—into your data lake. The solution streams new and changed data into Amazon S3. It also creates and updates appropriate data lake objects, providing a source-similar view of the data based on a schedule you configure. The AWS Glue Data Catalog then exposes the newly updated and de-duplicated data for analytics services to use.

Solution overview

I divide this solution into two AWS CloudFormation stacks. You can download the AWS CloudFormation templates I reference in this post from a public S3 bucket, or you can launch them using the links featured later. You can likewise download the AWS Glue jobs referenced later in this post.

The first stack contains reusable components. You only have to deploy it one time. It launches the following AWS resources:

  • AWS Glue jobs: Manages the workflow of the load process from the raw S3 files to the de-duped and optimized parquet files.
  • Amazon DynamoDB table: Persists the state of data load for each data lake table.
  • IAM role: Runs these services and accesses S3. This role contains policies with elevated privileges. Only attach this role to these services and not to IAM users or groups.
  • AWS DMS replication instance: Runs replication tasks to migrate ongoing changes via AWS DMS.

The second stack contains objects that you should deploy for each source you bring in to your data lake. It launches the following AWS resources:

  • AWS DMS replication task: Reads changes from the source database transaction logs for each table and stream that write data into an S3 bucket.
  • S3 buckets: Stores raw AWS DMS initial load and update objects, as well as query-optimized data lake objects.
  • AWS Glue trigger: Schedules the AWS Glue jobs.
  • AWS Glue crawler: Builds and updates the AWS Glue Data Catalog on a schedule.

Stack parameters

The AWS CloudFormation stack requires that you input parameters to configure the ingestion and transformation pipeline:

  • DMS source database configuration: The database connection settings that the DMS connection object needs, such as the DB engine, server, port, user, and password.
  • DMS task configuration: The settings the AWS DMS task needs, such as the replication instance ARN, table filter, schema filter, and the AWS DMS S3 bucket location. The table filter and schema filter allow you to choose which objects the replication task syncs.
  • Data lake configuration: The settings your stack passes to the AWS Glue job and crawler, such as the S3 data lake location, data lake database name, and run schedule.

Post-deployment

After you deploy the solution, the AWS CloudFormation template starts the DMS replication task and populates the DynamoDB controller table. Data does not propagate to your data lake until you review and update the DynamoDB controller table.

In the DynamoDB console, configure the following fields to control the data load process shown in the following table:

Field Description
ActiveFlag Required. When set to true, it enables this table for loading.
PrimaryKey A comma-separated list of column names. When set, the AWS Glue job uses these fields for processing update and delete transactions. When set to “null,” the AWS Glue job only processes inserts.
PartitionKey A comma-separated list of column names. When set, the AWS Glue job uses these fields to partition the output files into multiple subfolders in S3. Partitions can be valuable when querying and processing larger tables but may overcomplicate smaller tables. When set to “null,” the AWS Glue job only loads data into one partition.
LastFullLoadDate The data of the last full load. The AWS Glue job compares this to the date of the DMS-created full load file. Setting this field to an earlier value triggers AWS Glue to reprocess the full load file.
LastIncrementalFile The file name of the last incremental file. The AWS Glue job compares this to any new DMS-created incremental files. Setting this field to an earlier value triggers AWS Glue to reprocess any files with a larger name.

At this point, the setup is complete. At the next scheduled interval, the AWS Glue job processes any initial and incremental files and loads them into your data lake. At the next scheduled AWS Glue crawler run, AWS Glue loads the tables into the AWS Glue Data Catalog for use in your down-stream analytical applications.

Amazon Athena and Amazon Redshift

Your pipeline now automatically creates and updates tables. If you use Amazon Athena, you can begin to query these tables right away. If you use Amazon Redshift, you can expose these tables as an external schema and begin to query.

You can analyze these tables directly or join them to tables already in your data warehouse, or use them as inputs to an extract, transform, and load (ETL) process. For more information, see Creating External Schemas for Amazon Redshift Spectrum.

AWS Lake Formation

At the time of writing this post, AWS Lake Formation has been announced but not released. AWS Lake Formation makes it easy to set up a secure data lake. To incorporate Lake Formation in this solution, add the S3 location specified during launch as a “data lake storage” location and use Lake Formation to vend credentials to your IAM users.

AWS Lake Formation eliminates the need to grant S3 access via user, group, or bucket policies and instead provides a centralized console for granting and auditing access to your data lake.

Key features

A few built-in AWS CloudFormation key configurations make this solution possible. Understanding these features helps you replicate this strategy for other purposes or customize the application for your needs.

AWS DMS

  • The first AWS CloudFormation template deploys an AWS DMS replication instance. Before launching the second AWS CloudFormation template, ensure that the replication instance connects to your on-premises data source.
  • The AWS DMS endpoint for the S3 target has an extra connection attribute: addColumnName=true. This attribute tells DMS to add column headers to the output files. The process uses this header to build the metadata for the parquet files and the AWS Glue Data Catalog.
  • When the AWS DMS replication task begins, the initial load process writes files to the following location: s3:////
    /. It writes one file per table for the initial load named LOAD00000001.csv. It writes up to one file per minute for any data changes named .csv. The load process uses these file names to process new data incrementally.
  • The AWS DMS change data capture (CDC) process adds an additional field in the dataset “Op.” This field indicates the last operation for a given key. The change detection logic uses this field, along with the primary key stored in the DynamoDB table, to determine which operation to perform on the incoming data. The process passes this field along to your data lake, and you can see it when querying data.
  • The AWS CloudFormation template deploys two roles specific to DMS (DMS-CloudWatch-logs-role, DMS-VPC-role) that may already be in place if you previously used DMS. If the stack fails to build because of these roles, you can safely remove these roles from the template.
  • AWS Glue

    • AWS Glue has two types of jobs: Python shell and Apache Spark. The Python shell job allows you to run small tasks using a fraction of the compute resources and at a fraction of the cost. The Apache Spark job allows you to run medium- to large-sized tasks that are more compute- and memory-intensive by using a distributed processing framework. This solution uses the Python shell jobs to determine which files to process and to maintain the state in the DynamoDB table. It also uses Spark jobs for data processing and loading.
    • As changes stream in from your relational database, you may see new transactions appear as new files within a given folder. This load process behavior minimizes the impact on already loaded data. If this causes inconsistency in your file sizes or query performance, consider incorporating a compaction (file merging) process.
    • Between job runs, AWS Glue sequences duplicate transactions to the same primary key (for example, insert, then update) by file name and order. It determines the last transaction and uses it to re-write the impacted object to S3.
    • Configuration settings allow the Spark-type AWS Glue jobs a maximum of two DPUs of processing power. If your load jobs underperform, consider increasing this value. Increasing the job DPUs is most effective for tables set up with a partition key or when the DMS process generates multiple files between executions.
    • If your organization already has a long-running Amazon EMR cluster in place, consider replacing the AWS Glue jobs with Apache Spark jobs running within your EMR cluster to optimize your expenses.

    IAM

    • The solution deploys an IAM role named DMSCDC_Execution_Role. The role is attached to AWS services and is associated with AWS managed policies as well as an inline policy.
    • The AssumeRolePolicyDocument trust document for the role includes the following policies, which attach to the AWS Glue and AWS DMS services to ensure that the jobs have the necessary permissions to execute. AWS CloudFormation custom resources also use this role, backed by AWS Lambda, to initialize the environment.
         Principal :
           Service :
             - lambda.amazonaws.com
             - glue.amazonaws.com
             - dms.amazonaws.com
         Action :
           - sts:AssumeRole
      
    • The IAM role includes the following AWS managed policies. For more information, see Managed Policies and Inline Policies.
      ManagedPolicyArns:
           - arn:aws:iam::aws:policy/service-role/AWSGlueServiceRole
           - arn:aws:iam::aws:policy/AmazonS3FullAccess
           - arn:aws:iam::aws:policy/service-role/AWSLambdaVPCAccessExecutionRole
    • The IAM role includes the following inline policy. This policy includes permissions to execute the Lambda-backed AWS CloudFormation custom resources, initialize and manage the DynamoDB table, and initialize the DMS replication task.
         Action:
           - lambda:InvokeFunction
           - dynamodb:PutItem
           - dynamodb:CreateTable
           - dynamodb:UpdateItem
           - dynamodb:UpdateTable
           - dynamodb:GetItem
           - dynamodb:DescribeTable
           - iam:GetRole
           - iam:PassRole
           - dms:StartReplicationTask
           - dms:TestConnection
           - dms:StopReplicationTask
         Resource:
           - arn:aws:dynamodb:${AWS::Region}:${AWS::Account}:table/DMSCDC_*
           - arn:aws:lambda:${AWS::Region}:${AWS::Account}:function:DMSCDC_*
           - arn:aws:iam::${AWS::Account}:role/DMSCDC_*
           - arn:aws:dms:${AWS::Region}:${AWS::Account}:*:*"
         Action:
           - dms:DescribeConnections
           - dms:DescribeReplicationTasks
         Resource: '*'

    Sample database

    The following example illustrates what you see after deploying this solution using a sample database.

    The sample database includes three tables: product, store, and productorder. After deploying the AWS CloudFormation templates, you should see a folder created for each table in your raw S3 bucket.

    Each folder contains an initial load file.

    The table list populates the DynamoDB table.

    Set the active flag, primary key, and partition key values for these tables. In this example, I set the primary key for the product and store tables to ensure it processes the updates. I leave the primary key for the productorder table alone, because I do not expect update transactions. However, I set the partition key to ensure it partitions data by date.

    When the next scheduled AWS Glue job runs, it creates a folder for each table in your data lake S3 bucket.

    When the next scheduled AWS Glue crawler runs, your AWS Glue Data Catalog lists these tables. You can now query them using Athena.

    Similarly, you can query the data lake from within your Amazon Redshift cluster after first cataloging the external database.

    On subsequent AWS Glue job runs, the process compares the timestamp of the initial file with the “LastFullLoadDate” field in the DynamoDB table to determine if it should process the initial file again. It also compares the new incremental file names with the “LastIncrementalFile” field in the DynamoDB table to determine if it should process any incremental files. In the following example, it created a new incremental file for the product table.

    Examining the file shows two transactions: an update and a delete.

    When the AWS Glue job runs again, the DynamoDB table updates to list a new value for the “LastIncrementalFile.”

    Finally, the solution reprocesses the parquet file. You can query the data to see the new values for the updated record and ensure that it removes the deleted record.

    Summary

    In this post, I provided a set of AWS CloudFormation templates that allow you to quickly and easily sync transactional databases with your AWS data lake. With data in your AWS data lake, you can perform analysis on data from multiple data sources, build machine learning models, and produce rich analytics for your data consumers.

    If you have questions or suggestions, please comment below.


    About the Author

    Rajiv Gupta is a data warehouse specialist solutions architect with Amazon Web Services.

Sharma-ji, his ‘beta’, and his 140: Luck, talent and covering our Bayes-es in batting

$
0
0

Feed: Big Data Made Simple.
Author: Chinmoy Rajurkar.

India beat Pakistan after ruthless Rohit Sharma sets insurmountable target at Cricket World Cup” — The Telegraph

“India vs Pakistan: Rohit Sharma’s 140 sets up victory for Virat Kohli’s side” — BBC Sport

”India vs Pak: Rohit Sharma smashes 140, his 2nd ton of World Cup 2019″— The Economic Times

I come into work, it’s Monday morning. Need coffee, head to the kitchen to make myself a cup.

Couple of my colleagues are already in, chatting around the water cooler.

As is norm in an Indian office, cricket is at the top of everyone’s minds. The conversation turns to the match. India versus Pakistan. Arch rivals. Borderline enemies, quite literally.

A data engineer at the cooler makes a joke about databases, partitions and Indo-Pak relations, let’s pretend to laugh. Okay, I lied. I made the joke.

Don’t judge. Nothing like dark humor to brighten a Monday morning.

One colleague says that the match was won by MSD. Sure, if you say so.

Second one chimes in saying Sharma was the x-factor.

The third one just wants some coffee, never mind.

Now that I have some coffee in me, I start paying attention to the conversation. This whole idea of whether the prodigal Sharma was just lucky or whether he had the required form to hit a 140 is an interesting concept. How would I figure this out? The analyst in me finally wakes up to the problem statement. Yesssss. Finally.

Drum roll please. Drums roll.

Enter the Bayesian hierarchical modeling technique.

What are the chances, Mr. Sharma?

Sport analytics literature says that the average runs in an innings in Cricket can be ideally modeled with a Negative-Binomial distribution. This is something they found out in like 1977 or something. Nerds, I tell you.

This is where it gets a little nerdy. A little why-are-you-making-me-do-so-much-math-y. A little ugh-y. I really need to stop trying to rhyme.

This distribution has a couple of interesting, intuitive properties. Imagine a Poisson distribution where the variance is not quite equal to the average runs. Makes sense for a set of cricket innings, no?

For all the non-math people (aka 98% of the world), essentially this means we are modeling for count data (i.e., runs) where the average number of runs might be more or less static but the amount of variance is highly volatile, and not quite the same across all games.

A negative binomial distribution has two parameters. One for the Poisson distribution, that models the average.

The second is for a gamma-distribution that models the variance.

The final model can be summarized as

Note that we still haven’t taken into account the form and luck of the player.

I got all the batting scores Sharma had ever scored against Pakistan or had scored in 2019 (thanks, CricInfo, a couple of python scripts to pull the data from their databases did the job), and ran it through this very simple model over 10,000 simulations to get the posterior distribution.

Non-math definition: probable predictions with ranges.

Posterior Distribution for the Average Runs/Innings
Posterior Distribution for the variance

Indeed, running a summary on the model shows that Rohit Sharma’s true average of runs in an innings is closer to 50, with an upper cap at 65–70. Having a wide-distribution for the alpha parameter would also indicate a high amount of uncertainty in the variance of runs, which could be a clue towards some of his runs being driven by luck.

We simulate Rohit Sharma’s batting 50,000 from the posterior distribution to try and evaluate the survival curve for Rohit Sharma.

(Non-math definition: What are the chances of the player being not out at greater than 10 runs, greater than 20 runs, greater than 100 runs, etc.)

Here comes the clincher: the chance that Rohit Sharma could’ve scored 140 in this game is 0.00016.

One might debate/hate on the analysis with “Rohit Sharma’s form might have played a role in the 140 bro. Have you factored that in bro? How are you tackling that bro? You suck bro”

This is where Bayesian modeling gets interesting. Cue drum roll.

I should really hire a drummer-on-demand.

Is today your lucky day?

First off, no. If you’re this optimistic in life, you need help. A lot of it.

Secondly, and more to the point, how would we model luck and form? Intuitively, they are factors that affect the average of the player. In a multiplicative manner.

So, the average can essentially be modeled as

where the theta is the form and epsilon the luck component. The mu-with-a-cap term is the true average of the player.

We force a zero-sum constraint on the form and luck elements which means they are always in relation to the average form or luck across the matches, and hence more interpretative.

The thetas are drawn from standard normal distributions.

Having a log-linear model also allows the likelihood function to be better defined.

How does this model fit?

Not bad.

We model the scores in each of the innings against Pakistan and the predicted scores are pretty much in line with what actually happened.

Let’s decompose by form and luck and evaluate what happened in Match 30 (India vs. Pak, 2019)

We see that Rohit Sharma would’ve probably scored around 62–65 had it not been for luck in the game. The green line effectively shows the form of the player for the given dataset.

Regardless of the implications of such an analysis, it sure will make the conversations around the water-cooler more interesting!

Drop a comment regarding questions, feedback, free cookies, anything.

This article was published with permission from the author. You can find the original article here

Handling Large Data Volumes with MySQL and MariaDB

$
0
0

Feed: Planet MySQL
;
Author: Severalnines
;

Most databases grow in size over time. The growth is not always fast enough to impact the performance of the database, but there are definitely cases where that happens. When it does, we often wonder what could be done to reduce that impact and how can we ensure smooth database operations when dealing with data on a large scale.

First of all, let’s try to define what does a “large data volume” mean? For MySQL or MariaDB it is uncompressed InnoDB. InnoDB works in a way that it strongly benefits from available memory – mainly the InnoDB buffer pool. As long as the data fits there, disk access is minimized to handling writes only – reads are served out of the memory. What happens when the data outgrows memory? More and more data has to be read from disk when there’s a need to access rows, which are not currently cached. When the amount of data increase, the workload switches from CPU-bound towards I/O-bound. It means that the bottleneck is no longer CPU (which was the case when the data fit in memory – data access in memory is fast, data transformation and aggregation is slower) but rather it’s the I/O subsystem (CPU operations on data are way faster than accessing data from disk.) With increased adoption of flash, I/O bound workloads are not that terrible as they used to be in the times of spinning drives (random access is way faster with SSD) but the performance hit is still there.

Another thing we have to keep in mind that we typically only care about the active dataset. Sure, you may have terabytes of data in your schema but if you have to access only last 5GB, this is actually quite a good situation. Sure, it still pose operational challenges, but performance-wise it should still be ok.

Let’s just assume for the purpose of this blog, and this is not a scientific definition, that by the large data volume we mean case where active data size significantly outgrows the size of the memory. It can be 100GB when you have 2GB of memory, it can be 20TB when you have 200GB of memory. The tipping point is that your workload is strictly I/O bound. Bear with us while we discuss some of the options that are available for MySQL and MariaDB.

Partitioning

The historical (but perfectly valid) approach to handling large volumes of data is to implement partitioning. The idea behind it is to split table into partitions, sort of a sub-tables. The split happens according to the rules defined by the user. Let’s take a look at some of the examples (the SQL examples are taken from MySQL 8.0 documentation)

MySQL 8.0 comes with following types of partitioning:

  • RANGE
  • LIST
  • COLUMNS
  • HASH
  • KEY

It can also create subpartitions. We are not going to rewrite documentation here but we would still like to give you some insight into how partitions work. To create partitions, you have to define the partitioning key. It can be a column or in case of RANGE or LIST multiple columns that will be used to define how the data should be split into partitions.

HASH partitioning requires user to define a column, which will be hashed. Then, the data will be split into user-defined number of partitions based on that hash value:

CREATE TABLE employees (
    id INT NOT NULL,
    fname VARCHAR(30),
    lname VARCHAR(30),
    hired DATE NOT NULL DEFAULT '1970-01-01',
    separated DATE NOT NULL DEFAULT '9999-12-31',
    job_code INT,
    store_id INT
)
PARTITION BY HASH( YEAR(hired) )
PARTITIONS 4;

In this case hash will be created based on the outcome generated by YEAR() function on ‘hired’ column.

KEY partitioning is similar with the exception that user define which column should be hashed and the rest is up to the MySQL to handle.

While HASH and KEY partitions randomly distributed data across the number of partitions, RANGE and LIST let user decide what to do. RANGE is commonly used with time or date:

CREATE TABLE quarterly_report_status (
    report_id INT NOT NULL,
    report_status VARCHAR(20) NOT NULL,
    report_updated TIMESTAMP NOT NULL DEFAULT CURRENT_TIMESTAMP ON UPDATE CURRENT_TIMESTAMP
)
PARTITION BY RANGE ( UNIX_TIMESTAMP(report_updated) ) (
    PARTITION p0 VALUES LESS THAN ( UNIX_TIMESTAMP('2008-01-01 00:00:00') ),
    PARTITION p1 VALUES LESS THAN ( UNIX_TIMESTAMP('2008-04-01 00:00:00') ),
    PARTITION p2 VALUES LESS THAN ( UNIX_TIMESTAMP('2008-07-01 00:00:00') ),
    PARTITION p3 VALUES LESS THAN ( UNIX_TIMESTAMP('2008-10-01 00:00:00') ),
    PARTITION p4 VALUES LESS THAN ( UNIX_TIMESTAMP('2009-01-01 00:00:00') ),
    PARTITION p5 VALUES LESS THAN ( UNIX_TIMESTAMP('2009-04-01 00:00:00') ),
    PARTITION p6 VALUES LESS THAN ( UNIX_TIMESTAMP('2009-07-01 00:00:00') ),
    PARTITION p7 VALUES LESS THAN ( UNIX_TIMESTAMP('2009-10-01 00:00:00') ),
    PARTITION p8 VALUES LESS THAN ( UNIX_TIMESTAMP('2010-01-01 00:00:00') ),
    PARTITION p9 VALUES LESS THAN (MAXVALUE)
);

It can also be used with other type of columns:

CREATE TABLE employees (
    id INT NOT NULL,
    fname VARCHAR(30),
    lname VARCHAR(30),
    hired DATE NOT NULL DEFAULT '1970-01-01',
    separated DATE NOT NULL DEFAULT '9999-12-31',
    job_code INT NOT NULL,
    store_id INT NOT NULL
)
PARTITION BY RANGE (store_id) (
    PARTITION p0 VALUES LESS THAN (6),
    PARTITION p1 VALUES LESS THAN (11),
    PARTITION p2 VALUES LESS THAN (16),
    PARTITION p3 VALUES LESS THAN MAXVALUE
);

The LIST partitions work based on a list of values that sorts the rows across multiple partitions:

CREATE TABLE employees (
    id INT NOT NULL,
    fname VARCHAR(30),
    lname VARCHAR(30),
    hired DATE NOT NULL DEFAULT '1970-01-01',
    separated DATE NOT NULL DEFAULT '9999-12-31',
    job_code INT,
    store_id INT
)
PARTITION BY LIST(store_id) (
    PARTITION pNorth VALUES IN (3,5,6,9,17),
    PARTITION pEast VALUES IN (1,2,10,11,19,20),
    PARTITION pWest VALUES IN (4,12,13,14,18),
    PARTITION pCentral VALUES IN (7,8,15,16)
);

What is the point in using partitions you may ask? The main point is that the lookups are significantly faster than with non-partitioned table. Let’s say that you want to search for the rows which were created in a given month. If you have several years worth of data stored in the table, this will be a challenge – an index will have to be used and, as we know, indexes help to find rows but accessing those rows will result in a bunch of random reads from the whole table. If you have partitions created on year-month basis, MySQL can just read all the rows from that particular partition – no need for accessing index, no need for doing random reads: just read all the data from the partition, sequentially, and we are all set.

Partitions are also very useful in dealing with data rotation. If MySQL can easily identify rows to delete and map them to single partition, instead of running DELETE FROM table WHERE …, which will use index to locate rows, you can truncate the partition. This is extremely useful with RANGE partitioning – sticking to the example above, if we want to keep data for 2 years only, we can easily create a cron job, which will remove old partition and create a new, empty one for next month.

InnoDB Compression

If we have a large volume of data (not necessarily thinking about databases), the first thing that comes to our mind is to compress it. There are numerous tools that provide an option to compress your files, significantly reducing their size. InnoDB also has an option for that – both MySQL and MariaDB supports InnoDB compression. The main advantage of using compression is the reduction of the I/O activity. Data, when compressed, is smaller thus it is faster to read and to write. Typical InnoDB page is 16KB in size, for SSD this is 4 I/O operations to read or write (SSD typically use 4KB pages). If we manage to compress 16KB into 4KB, we just reduced I/O operations by four. It does not really help much regarding dataset to memory ratio. Actually, it may even make it worse – MySQL, in order to operate on the data, has to decompress the page. Yet it reads compressed page from disk. This results in InnoDB buffer pool storing 4KB of compressed data and 16KB of uncompressed data. Of course, there are algorithms in place to remove unneeded data (uncompressed page will be removed when possible, keeping only compressed one in memory) but you cannot expect too much of an improvement in this area.

It is also important to keep in mind how compression works regarding the storage. Solid state drives are norm for database servers these days and they have a couple of specific characteristics. They are fast, they don’t care much whether traffic is sequential or random (even though they still prefer sequential access over the random). They are expensive for large volumes. They suffer from “worn out” as they can handle a limited number of write cycles. Compression significantly helps here – by reducing the size of the data on disk, we reduce the cost of the storage layer for database. By reducing the size of the data we write to disk, we increase the lifespan of the SSD.

Unfortunately, even if compression helps, for larger volumes of data it still may not be enough. Another step would be to look for something else than InnoDB.

MyRocks

MyRocks is a storage engine available for MySQL and MariaDB that is based on a different concept than InnoDB. My colleague, Sebastian Insausti, has a nice blog about using MyRocks with MariaDB. The gist is, due to its design (it uses Log Structured Merge, LSM), MyRocks is significantly better in terms of compression than InnoDB (which is based on B+Tree structure). MyRocks is designed for handling large amounts of data and to reduce the number of writes. It originated from Facebook, where data volumes are large and requirements to access the data are high. Thus SSD storage – still, on such a large scale every gain in compression is huge. MyRocks can deliver even up to 2x better compression than InnoDB (which means you cut the number of servers by two). It is also designed to reduce the write amplification (number of writes required to handle a change of the row contents) – it requires 10x less writes than InnoDB. This, obviously, reduces I/O load but, even more importantly, it will increase lifespan of a SSD ten times compared with handing the same load using InnoDB). From a performance standpoint, smaller the data volume, the faster the access thus storage engines like that can also help to get the data out of the database faster (even though it was not the highest priority when designing MyRocks).

Columnar Datastores

At some point all we can do is to admit that we cannot handle such volume of data using MySQL. Sure, you can shard it, you can do different things but eventually it just doesn’t make sense anymore. It is time to look for additional solutions. One of them would be to use columnar datastores – databases, which are designed with big data analytics in mind. Sure, they will not help with OLTP type of the traffic but analytics are pretty much standard nowadays as companies try to be data-driven and make decisions based on exact numbers, not random data. There are numerous columnar datastores but we would like to mention here two of those. MariaDB AX and ClickHouse. We have a couple of blogs explaining what MariaDB AX is and how can MariaDB AX be used. What’s important, MariaDB AX can be scaled up in a form of a cluster, improving the performance. ClickHouse is another option for running analytics – ClickHouse can easily be configured to replicate data from MySQL, as we discussed in one of our blog posts. It is fast, it is free and it can also be used to form a cluster and to shard data for even better performance.

Conclusion

We hope that this blog post gave you insights into how large volumes of data can be handled in MySQL or MariaDB. Luckily, there are a couple of options at our disposal and, eventually, if we cannot really make it work, there are good alternatives.

groupdata2 version 1.1.0 released on CRAN

$
0
0

Feed: R-bloggers.
Author: Ludvig Olsen.

(This article was first published on R, and kindly contributed to R-bloggers)

A few days ago, I released a new version of my R package, groupdata2, on CRAN. groupdata2 contains a set of functions for grouping data, such as creating balanced partitions and folds for cross-validation.

Version 1.1.0 adds the balance() function for using up- and downsampling to balance the categories (e.g. classes) in your dataset. The main difference between existing up-/downsampling tools and balance() is that it has methods for dealing with IDs. If, for instance, our dataset contains a number of participants with multiple measurements (rows) each, we might want to either keep all the rows of a participant or delete all of them, e.g. if we are measuring the effect of time and need all the timesteps for a meaningful analysis. balance() currently has four methods for dealing with IDs. As it is a new function, I’m very open to ideas for improvements and additional functionality. Feel free to open an issue on github or send me a mail at r-pkgs at ludvigolsen.dk

partition() and fold() can now balance the groups (partitions/folds) by a numerical column. In short, the rows are ordered as smallest, largest, second smallest, second largest, etc. (I refer to this as extreme pairing in the documentation), and grouped as pairs. This seems to work pretty well, especially with larger datasets.

fold() can now create multiple unique fold columns at once, e.g. for repeated cross-validation with cvms. As ensuring the uniqueness of the fold columns can take a while, I’ve added the option to run the column comparisons in parallel. You need to register a parallel backend first (E.g. with doParallel::registerDoParallel).

The new helper function differs_from_previous() finds values, or indices of values, that differ from the previous value by some threshold(s). It is related to the “l_starts” method in group().

groupdata2 can be installed with:

CRAN:
install.packages("groupdata2")
Development version:
devtools::install_github("ludvigolsen/groupdata2")

Indlægget groupdata2 version 1.1.0 released on CRAN blev først udgivet på .

To leave a comment for the author, please follow the link and comment on their blog: R.

R-bloggers.com offers daily e-mail updates about R news and tutorials on topics such as: Data science, Big Data, R jobs, visualization (ggplot2, Boxplots, maps, animation), programming (RStudio, Sweave, LaTeX, SQL, Eclipse, git, hadoop, Web Scraping) statistics (regression, PCA, time series, trading) and more…


If you got this far, why not subscribe for updates from the site? Choose your flavor: e-mail, twitter, RSS, or facebook

Kirk Roybal: Partitioning enhancements in PostgreSQL 12

$
0
0

Feed: Planet PostgreSQL.

Declarative partitioning got some attention in the PostgreSQL 12 release, with some very handy features. There has been some pretty dramatic improvement in partition selection (especially when selecting from a few partitions out of a large set), referential integrity improvements, and introspection.

In this article, we’re going to tackle the referential integrity improvement first. This will provide some sample data to use later for the other explanations. And the feature is just amazingly cool, so it goes first anyway.

This example builds on the example given for the Generated columns in PostgreSQL 12 article, where we built a media calendar by calculating everything you ever wanted to know about a date. Here’s the short version of the code:

CREATE TABLE public.media_calendar (
    gregorian date NOT NULL PRIMARY KEY,
    month_int integer GENERATED ALWAYS AS (date_part('month'::text, gregorian)) STORED,
    day_int integer GENERATED ALWAYS AS (date_part('day'::text, gregorian)) STORED,
    year_int integer GENERATED ALWAYS AS (date_part('year'::text, gregorian)) STORED,
    quarter_int integer GENERATED ALWAYS AS (date_part('quarter'::text, gregorian)) STORED,
    dow_int integer GENERATED ALWAYS AS (date_part('dow'::text, gregorian)) STORED,
    doy_int integer GENERATED ALWAYS AS (date_part('doy'::text, gregorian)) STORED
    ...snip...
    );

INSERT INTO public.media_calendar (gregorian)
SELECT '1900-01-01'::date + x
-- Starting with 1900-01-01, fill the table with 200 years of data.
FROM generate_series(0,365*200) x;

Now, we’re going to add a time dimension to our model, and relate the date and time together for a 200 year calendar that’s accurately computed to the second.

CREATE TABLE time_dim (

time_of_day time without time zone not null primary key,
hour_of_day integer GENERATED ALWAYS AS (date_part('hour', time_of_day)) stored,
minute_of_day integer GENERATED ALWAYS AS (date_part('minute', time_of_day)) stored,
second_of_day integer GENERATED ALWAYS AS (date_part('second', time_of_day)) stored,
morning boolean GENERATED ALWAYS AS (date_part('hour',time_of_day)<12) stored,
afternoon boolean GENERATED ALWAYS AS (date_part('hour',time_of_day)>=12 AND date_part('hour',time_of_day)<18) stored,
evening boolean GENERATED ALWAYS AS (date_part('hour',time_of_day) >= 18) stored    

);

INSERT INTO time_dim (time_of_day ) 
SELECT '00:00:00'::time + (x || ' seconds')::interval 
FROM generate_series (0,24*60*60-1) x;  -- start with midnight, add seconds in a day;

We should now have 86400 rows in the time dimension, and 73001 rows in our 200 year media calendar. Of course, when we decide to relate these together, a cartesian join produces a bit over 6 billion rows (6,307,286,400). The good news is that this table is unlikely to grow, unless Ceasar decides to add more days to the year, or the EU decides to add more seconds to a day (grumble, grumble). So, it makes a good candidate to partition, with a very easily calculated key.

CREATE TABLE hours_to_days (
    day date not null references media_calendar(gregorian),
    time_of_day time without time zone not null references time_dim(time_of_day),
    full_date timestamp without time zone GENERATED ALWAYS AS (day + time_of_day) stored,
    PRIMARY KEY (day,time_of_day)
) PARTITION BY RANGE (day);

CREATE INDEX idx_natural_time ON hours_to_days(full_date);

You just saw a new feature that was created in PostgreSQL 11 (not a typo, I mean 11). You may have a parent->child foreign key that references a partitioned table.

Ok, we were allowed to do that, so let’s get on with the PostgreSQL 12 partitioning lesson.

CREATE TABLE hours_to_days_ancient PARTITION OF hours_to_days
    FOR VALUES FROM (minvalue) TO ('1990-01-01');

CREATE TABLE hours_to_days_sep PARTITION OF hours_to_days
    FOR VALUES FROM ('2040-01-01') TO (maxvalue);

CREATE TABLE hours_to_days_1990 PARTITION OF hours_to_days
    FOR VALUES FROM ('1990-01-01') TO ('2000-01-01');

CREATE TABLE hours_to_days_2000 PARTITION OF hours_to_days
    FOR VALUES FROM ('2000-01-01') TO ('2010-01-01');

CREATE TABLE hours_to_days_2010 PARTITION OF hours_to_days
    FOR VALUES FROM ('2010-01-01') TO ('2020-01-01');

CREATE TABLE hours_to_days_2020 PARTITION OF hours_to_days
    FOR VALUES FROM ('2020-01-01') TO ('2030-01-01');

CREATE TABLE hours_to_days_2030 PARTITION OF hours_to_days
    FOR VALUES FROM ('2030-01-01') TO ('2040-01-01');

Notice that the partitions do not have to be evenly distributed in the range, the data quantity, or any other criteria. The only requirement is that all dates are included in one (and only one) partition.

INSERT INTO hours_to_days (day, time_of_day) 
SELECT gregorian, time_of_day
FROM media_calendar
CROSS JOIN time_dim;

Now, go get some coffee, because we’re going to get 6.3B rows.

Now, we’re finally going to get to the first PostgreSQL 12 enhancement. In the latest version of PostgreSQL, you may have a foreign key relationship where the partitioned table is the child.

CREATE TABLE sale (
    id bigserial primary key,
    transaction_date date not null default now()::date,
    transaction_time time without time zone not null default date_trunc('seconds', now()::time), 
    FOREIGN KEY (transaction_date, transaction_time) REFERENCES hours_to_days(day,time_of_day)
);

Wow! Well, “”wow” for people who can get excited about code. This means that you can have a partitioned dimensional model! You can have partitioned OLAP! You can have partitioned geophysical data, or any other kind of data, without losing referential integrity. That’s big news to data modeling at the edge of the diagram.

Now let’s look at the partitions that we just created. How, you ask? Well, with the new introspection tools in PostgreSQL 12, of course. Those are:

pg_partition_tree, pg_partition_ancestors, pg_partition_root

Let’s explore those with the partitions we created.

When we look at our partitioned parent table, the results are underwhelming:

d hours_to_days

                                     Partitioned table "public.hours_to_days"
   Column    |            Type             | Collation | Nullable |                    Default
-------------+-----------------------------+-----------+----------+------------------------------------------------
 day         | date                        |           | not null |
 time_of_day | time without time zone      |           | not null |
 full_date   | timestamp without time zone |           |          | generated always as (day + time_of_day) stored
Partition key: RANGE (day)
Indexes:
    "hours_to_days_pkey" PRIMARY KEY, btree (day, time_of_day)
    "idx_natural_time" btree (full_date)
Foreign-key constraints:
    "hours_to_days_day_fkey" FOREIGN KEY (day) REFERENCES media_calendar(gregorian)
    "hours_to_days_time_of_day_fkey" FOREIGN KEY (time_of_day) REFERENCES time_dim(time_of_day)
Number of partitions: 7 (Use d+ to list them.)

We see a bit of the partition info, but not anywhere near what we’d like to know. We get a bit more with enhancing:

dS+  hours_to_days  --<-- note the Splus
                                                         Partitioned table "public.hours_to_days"
   Column    |            Type             | Collation | Nullable |                    Default                     | Storage | Stats target | Description
-------------+-----------------------------+-----------+----------+------------------------------------------------+---------+--------------+-------------
 day         | date                        |           | not null |                                                | plain   |              |
 time_of_day | time without time zone      |           | not null |                                                | plain   |              |
 full_date   | timestamp without time zone |           |          | generated always as (day + time_of_day) stored | plain   |              |
Partition key: RANGE (day)
Indexes:
    "hours_to_days_pkey" PRIMARY KEY, btree (day, time_of_day)
    "idx_natural_time" btree (full_date)
Foreign-key constraints:
    "hours_to_days_day_fkey" FOREIGN KEY (day) REFERENCES media_calendar(gregorian)
    "hours_to_days_time_of_day_fkey" FOREIGN KEY (time_of_day) REFERENCES time_dim(time_of_day)
Partitions: hours_to_days_1990 FOR VALUES FROM ('1990-01-01') TO ('2000-01-01'),
            hours_to_days_2000 FOR VALUES FROM ('2000-01-01') TO ('2010-01-01'),
            hours_to_days_2010 FOR VALUES FROM ('2010-01-01') TO ('2020-01-01'),
            hours_to_days_2020 FOR VALUES FROM ('2020-01-01') TO ('2030-01-01'),
            hours_to_days_2030 FOR VALUES FROM ('2030-01-01') TO ('2040-01-01'),
            hours_to_days_ancient FOR VALUES FROM (MINVALUE) TO ('1990-01-01'),
            hours_to_days_sep FOR VALUES FROM ('2040-01-01') TO (MAXVALUE)

Ok, now we see a list of partitions. In the interest of shortening this article a bit, I won’t give the sub-partitioning example. However, trust me to say that if sub partitions existed, this method would not list them.

SELECT * FROM pg_partition_tree('hours_to_days');

         relid         |  parentrelid  | isleaf | level
-----------------------+---------------+--------+-------
 hours_to_days         |               | f      |     0
 hours_to_days_ancient | hours_to_days | t      |     1
 hours_to_days_sep     | hours_to_days | t      |     1
 hours_to_days_1990    | hours_to_days | t      |     1
 hours_to_days_2000    | hours_to_days | t      |     1
 hours_to_days_2010    | hours_to_days | t      |     1
 hours_to_days_2020    | hours_to_days | t      |     1
 hours_to_days_2030    | hours_to_days | t      |     1

Here we would see any sub partitions and the partition levels. Here we have “level” to identify the node priority, including “0” which is the root node, and “parentrelid” to show node ownership. With that basic information, we can easily build a relationship tree.

We also have another, even simpler way to get to the root node.

SELECT * FROM pg_partition_root('hours_to_days_sep');
 pg_partition_root
-------------------
 hours_to_days
(1 row)

As well as the other way around. This shows the inheritance tree from any branch backwards toward the root.

SELECT * FROM pg_partition_ancestors('hours_to_days_sep');
       relid
-------------------
 hours_to_days_sep
 hours_to_days
(2 rows)

And if we are using psql for a client, we have a new internal command to show partitions and indexes.

dP
                        List of partitioned relations
 Schema |        Name         |  Owner  |       Type        |     Table
--------+---------------------+---------+-------------------+----------------
 public | hours_to_days       | kroybal | partitioned table |
 public | media_calendar      | kroybal | partitioned table |
 public | hours_to_days_pkey  | kroybal | partitioned index | hours_to_days
 public | idx_natural_time    | kroybal | partitioned index | hours_to_days
 public | media_calendar_pkey | kroybal | partitioned index | media_calendar
(5 rows)

Following in the footsteps of many other commands,

ALTER TABLE ... ATTACH PARTITION

has eliminated the need for an EXCLUSIVE lock. This means that you can create new partitions, and add them to the partition set at run time, without using a maintenance window. Unfortunately, the reverse is not true. ALTER TABLE … DETACH PARTITION is still EXCLUSIVE lock dependent, so on-the-fly detachment still needs a lock, if only very briefly.

Several more improvements have been made, that really require no extended explanation:

1. The COPY command has reduced a bit of overhead, allowing for faster loading.
2. The tablespace specification for a parent is now inherited by the child.
3. pg_catalog.pg_indexes now shows indexes on partitioned children.

And that wraps it up for the new enhancements. Stay tuned for more articles about other features that will appear in PostgreSQL 12.

Diagnostic Data Processing on Cloudera Altus

$
0
0

Feed: Cloud – Cloudera Engineering Blog.
Author: Shelby Khan.

Cloudera Altus architecture

Fig 1 – Architecture

Introduction

Many of Cloudera’s customers set up Cloudera Manager to collect their clusters’ diagnostic data on a regular schedule and automatically send that data to Cloudera. Cloudera analyzes this data, identifies potential problems in the customer’s environment, and alerts customers, requiring fewer back-and-forths with our customers when they file a support case and provides Cloudera with critical information to improve future versions of all of Cloudera’s software. If Cloudera discovers a serious issue, Cloudera searches this diagnostic data and proactively notifies Cloudera customers who might encounter problems due to the issue. This blog post explains how Cloudera internally uses the Altus as a Service platform in the cloud to perform these analyses. Offloading processing and ad-hoc visualization to the cloud reduces costs since compute resources are used only when needed. Transient ETL workloads process incoming data and stateless data warehouse clusters are used for ad-hoc visualizations. The clusters share metadata via Altus SDX.

Overview

In Cloudera EDH, diagnostic bundles are ingested from customer environments and normalized using Apache NiFi. The bundles are stored in an AWS S3 bucket with date-based partitions (Step 1 in Fig 1). AWS Lambda is scheduled daily (Step 2 in Fig 1) to process the previous day’s data (Step 3 in Fig 1) by spinning up Altus Data Engineering clusters to execute ETL processing and terminating the clusters on job completion. The jobs on these DE clusters produce a fact table and three dimension tables (Star schema). This extracted data is stored in a different S3 bucket (Step 4 in Fig 1) and the metadata produced from these processes, such as schema and partitions, are stored in Altus SDX (Step 5 in Fig 1). Whenever data needs to be visualized, a stateless Altus Data Warehouse cluster is created, which provides easy access to the data via the built-in SQL Editor or JDBC/ODBC Impala connector (Step 6,7 in Fig 1).

Altus SDX

We create configured SDX namespaces for sharing metadata and fine-grained authorization between workloads that run on clusters that we create in Altus Data Engineering and Data Warehouse. Configured SDX namespaces are built on Hive metastore and Sentry databases. These databases are set up and managed by Altus customers.

First, we will create two databases in an external database.

Fig 2 – Hive and Sentry external database creation

We will then create a configured namespace using those databases.

configured namespace creation cloudera altus

Fig 3 – Configured namespace creation

Altus will initialize the schemas of Hive metastore and Sentry databases when a cluster using a configured namespace is started. We chose to grant namespace admin group all privileges so that when the internal user ‘altus’, who executes the Spark job in Data Engineering clusters, has necessary DDL permissions.

Altus Data Engineering

We need to process the bundles that were uploaded the previous day. To do this, we need a mechanism to start an Altus Data Engineering cluster periodically, which executes the job and terminates after the processing is done. We execute an AWS Lambda function that is periodically triggered by an AWS Cloudwatch rule. This AWS Lambda uses Altus Java SDK to kick off an ephemeral Data Engineering cluster with a Spark job.

This will process the diagnostic data that was stored in a S3 bucket. It will create a fact table and three dimension tables. The data for those tables will be stored in a different S3 bucket. The metadata will be stored in Altus SDX. The cluster is deleted at the end as the job only runs for 30 minutes.

Altus Data Warehouse

Whenever we want to analyze the data, we spin up an Altus Data Warehouse cluster in the same environment, using the same namespace as the Altus Data Engineering cluster. Doing so allows the Altus Data Warehouse to have direct access to the data and metadata created by the Altus Data Engineering clusters.

data warehouse cluster creation

Fig 4 – Data Warehouse cluster creation

Once the cluster is created we can use the built-in Query Editor to quickly analyze the data.

Query Data Warehouse cluster using SQL Editor

Fig 5 – Query Data Warehouse cluster using SQL Editor

If you need to generate custom dashboards, connect  to the Altus Data Warehouse clusters using Cloudera Impala JDBC/ODBC connector. Recently, we released a new Impala JDBC driver which can connect to an Altus Data Warehouse cluster by simply specifying the cluster’s name.

Data Warehouse JDBC connection using cluster name

Fig 6 – Data Warehouse JDBC connection using cluster name

In the image above, we show how easy it is to connect Tableau to the tables in Altus Data Warehouse.

Visualizing distribution of services in the Cloudera clusters

Fig 7 – Visualizing distribution of services in the Cloudera clusters

In the above visualization, you can see the distribution of services running in Cloudera clusters. Note that this is based on a random dataset.

What’s Next?

To get started with a 30-day free Altus trial, visit us at https://www.cloudera.com/products/altus.html. Send questions or feedback to the Altus community forum.


How to Enjoy Hybrid Partitioning with Teradata Columnar

$
0
0

Feed: Teradata Blog.

Hybrids are nothing new. One of my favorite fruits, the nectarine, is a hybrid between a peach and a plum. Hybrid tea roses, one of the most recognized and popular variety of cut flowers, are a cross between hybrid perpetual roses and old-fashioned tea roses. Look around you and you’ll likely see many other examples of successful hybrids, even in a relational database system.

Teradata Columnar, for example, offers a hybrid of two different database table partitioning choices: column partitioning and row partitioning. But before delving into a description of column/row hybrid partitioning, let’s first examine row then column partitioning individually.

First Came Row Formatted Data

The Teradata NewSQL Engine was architected to store data for a table a row at a time. Each physical record that is loaded into the database is transformed into a row and assigned to one of AMPs (parallel units) in the configuration. This assignment takes place in way that maintains an even spread of data across all AMPs systemwide. When data is stored by row, you can retrieve all its column values in one physical I/O.

Figure 1:  Data stored in row-based units.

Then the Option of Partitioning the Rows

An additional option exists for tables stored by row, called “row partitioning”. Rows can be grouped on disk by a “partitioning column.” An example of a partitioning column for a row-formatted table is a date column, such as TxnDate. When a table is partitioned by TxnDate, all the rows for transactions that took place on a specific unit of time, such as day, week, or month, are stored together in a partition. When using row partitioning, the database will apply “partition elimination” and only read the data rows that meet the query’s partitioning column predicate values. The less data that is read, the faster a query will return an answer set.

Figure 2:  Data stored using row partitioning based on TxnDate.

Columnar  

Teradata Columnar is an enhancement that offers the ability to store the data in a table by column, instead of by row. In its simplest form, each column in the table becomes its own column partition. The benefit of Columnar is faster execution time for queries that access a subset of a table’s columns, because less data will have to be read from the database. 

With a basic Columnar implementation, each physical row that is stored on disk is a collection of values from one column. If your table has 100 columns but each query that accesses the table only needs 5 of those columns, Columnar can greatly reduce the physical I/O required to read the table.

Figure 3:  Data stored using column partitioning.

With Columnar, a specific column partition, such as the one for ItemNo, will only be accessed if a query references the ItemNo column, otherwise that partition will be skipped. In addition, various forms of compression are automatically applied to each physical row that holds these column values as the physical row is being constructed, contributing to space savings in the storage subsystem.

One of the unique advantages of Teradata Columnar is that it is an option you can choose to use or choose not to use. Some tables are more suitable for row-formatting, for example tables that are small or tables whose have a high percentage of their columns frequently accessed. With Teradata, you have a choice of formatting by row or column, so you can match the physical structure of the table with how the table will be accessed.

To better understand the differences between row and column partitioning, consider an architectural example where there are two different, contrasting approaches to constructing living spaces.

Partitioning by family—separate dwellings

This is similar to row partitioning. Each unit contains all the necessary components of household living—a living room, a bedroom, a bathroom, a kitchen, a laundry room. Each house, apartment, or any other bundled set of these different components is located physically separate from any other such dwelling. Once you are in the house, you can easily move from kitchen to living room, to bedroom.

Partitioning by function—dormitories

Dormitories like column partitioning. Various rooms that people live in are grouped together by function. Bedrooms are congregated in one section of the structure. There is a separate shared dining area and a large group laundry area in the basement. When you enter a dormitory, you can either enter the sleeping area, the eating area, or the shared living area, but moving between the different functional areas is more of an effort.

As with database design, there are tradeoffs in selecting the right living space for you.  Dormitories have economy of scale advantages, particularly in the area of energy conservation, landscaping, mail delivery, more efficient use of space, and cost to live there. But separate dwellings offer more privacy, more control over your environment, ease of moving between functional areas, and the ability to customize your surroundings.

Introducing Hybrid Partitioning

In Teradata Vantage you can combine both types of partitioning into “hybrid partitioning.” Partition by column, and then on top of that partition by row, using a column such as TxnDate to define the borders of the row partitioning. This creates smaller partitions, each which represents the intersection of a column partition and a row partition.

The table below illustrates hybrid partitioning. In that table, all the column values for Quantity will be segregated by the TxnDate of their logical row. If the query requests Quantify data for transactions with a TxnDate of “05-29-2011′ then the only the first three Quantity values will be read from disk.
columnar-pic-4-(1).png

Figure 4:  Data stored using hybrid partitioning.

Partition elimination is even more effective with hybrid partitioning because just these combined partitions associated to the TxnDate range expressed in the query are physically accessed. Less data read leads to faster query execution times. Tables with hybrid partitioning are particularly suitable for large tables that store sales data, sensor data, web click data, or other time-qualified events.

Tables with hybrid partitioning are particularly suitable for large tables that store sales data, sensor data, web click data, or other time-qualified events.

From my love of eating nectarines to my enjoyment of smelling tea roses, experience has taught me that hybrid solutions are often significantly better than the parent entities from which they were born. The same is true of the column-row hybrid partitioning option. It’s the best of both worlds, and one of many performance-enhancing options within Vantage’s NewSQL Engine.

The MySQL 8.0.17 Maintenance Release is Generally Available

$
0
0

Feed: Planet MySQL
;
Author: Geir Hoydalsvik
;

The MySQL Development team is very happy to announce that MySQL 8.0.17 is now available for download at dev.mysql.com. In addition to bug fixes there are a few new features added in this release.  Please download 8.0.17 from dev.mysql.com or from the MySQL  YumAPT, or SUSE repositories. The source code is available at GitHub. You can find the full list of changes and bug fixes in the 8.0.17 Release Notes. Here are the highlights. Enjoy!

Provisioning by Cloning

We have implemented native provisioning in the server. For example, a newly created, thus empty server instance can be told to clone its state from another running server. Previously you had to use mysqldump or backup to create the initial state. The cloning process is fully automated and easy to use from the MySQL Shell. For example, if you want to add a new server to a running MySQL InnoDB Cluster, you can simply start a new server and tell it to join the cluster.

Clone local replica (WL#9209) This work by Debarun Banerjee creates a server plugin that can be used to retrieve a snapshot of the running system. This work adds syntax for taking a physical snapshot of the database and store it on the machine where the database server is running.

Clone remote replica (WL#9210) This work by Debarun Banerjee enhances the server clone plugin created in WL#9209 to connect to a remote server and transfer the snapshot over the network, i.e. to the machine where the replica needs to be provisioned.

Clone Remote provisioning (WL#11636) This work by Debarun Banerjee simplifies provisioning by allowing cloning directly into the recipient’s current data directory, and furthermore, allows the cloning process to be completely driven via SQL command after a server is started. This work also implements pre-condition checks before cloning and refuses to clone if pre-conditions are not satisfied.

Clone Replication Coordinates (WL#9211) This work by Debarun Banerjee implements support for extracting, propagating and storing consistent replication positions during the process of cloning a server as depicted by WL#9209 and WL#9210. The donor server extracts and sends consistent replication positions to the recipient server.  The recipient server stores and uses them to start replicating from a consistent logical point in time with respect to the data it copied from the donor.

Support cloning encrypted database (WL#9682) This work by Debarun Banerjee adds support for cloning of encrypted tables, general tablespaces, undo tablespaces and redo logs. It works both with the local key management service and with a centralized key management solution, i.e. MySQL Enterprise Transparent Data Encryption (TDE).

Multi-valued indexes

Multi-valued indexes make it possible to index JSON arrays. A multi-valued index is an index where multiple index records can point to the same data record. Take the following JSON document as an example: {user: John, user_id: 1, addr: [ {zip:94582} , {zip: 94536} ] }. Here, if we’d like to search all zip codes, we’d have to have two records in the index, one for each zip code in the document, both pointing to the same document.

Such an index is created by the statement CREATE INDEX zips ON t1((CAST(data-> '$.addr[*].zip' AS UNSIGNED ARRAY))); Effectively it’s a functional index which uses the CAST() function to cast JSON arrays to an array of SQL type. At least for now, multi-valued indexes can only be created for JSON arrays.

As soon as a multi-valued index has been created it will be used automatically by the optimizer, like any single-valued index. Multi-valued indexes will typically be used in queries involving  MEMBER OF(), JSON_CONTAINS() and JSON_OVERLAPS(). For example: SELECT * FROM t1 WHERE 123 MEMBER OF (data->'$.addr[*].zip'); passes all documents that contain zip code 123. JSON_CONTAINS() searches multiple keys but passes only those documents in which all keys are present. JSON_OVERLAPS() also searches for multiple keys, but passes when at least one key is present in the document.

The JSON_OVERLAPS() function is a new JSON function added in this release. The MEMBER OF() function is standard SQL syntax added in this release. At least for now, the only valid input for MEMBER OF() is a JSON array.

The work on multi-valued indexes includes changes in the Server layer by Evgeny Potemkin (WL#8955) and in InnoDB by Bin Su (WL#8763). The Document Store (XPlugin) integration has been done by Grzegorz Szwarc (WL#10604).

JSON Schema

Add support for JSON Schema (WL#11999) This work by Erik Froseth implements the function JSON_SCHEMA_VALID(, ) which  validates a JSON document against a JSON Schema. The first argument to JSON_SCHEMA_VALID is the JSON Schema definition, and the second argument is the JSON document the user wants to validate. JSON_SCHEMA_VALID() can be very useful as a CHECK constraint.

Implement JSON_SCHEMA_VALIDATION_REPORT (WL#13005)  This work by Erik Froseth implements the function JSON_SCHEMA_VALIDATION_REPORT(, ) that prints out a structured JSON object giving a more detailed report of the JSON Schema validation in case of errors.

Optimizer improvements

Subquery optimisation: Transform NOT EXISTS and NOT IN to anti-semi-join (WL#4245) This work by Guilhem Bichot converts NOT IN and NOT EXISTS into anti-joins, which makes the subquery disappear. The transformation provides for better cost planning, i.e. by bringing subquery tables into the top query’s plan, and also by merging semi-joins and anti-joins together, we will gain more freedom to re-order tables in the execution plan, and thus sometimes find better plans.

Ensure that all predicates in SQL conditions are complete (WL#12358) This work by Roy Lyseng ensures that incomplete predicates are substituted for non-equalities during the contextualization phase, thus the resolver, the optimizer and the executor will only have to deal with complete predicates.

Add CAST to FLOAT/DOUBLE/REAL (WL#529) This work by Catalin Besleaga extends the CAST function to support cast operations to FLOATING point data types according to the SQL Standard. This aligns the explicit CAST support with implicit CASTs which have had a greater variety of cast possibilities.

Volcano iterator

The work is based on the Volcano model, see the original Volcano paper here. The goal of this activity is to simplify the code base, enable new features such as hash join, and enable a better EXPLAIN and EXPLAIN ANALYZE.

Volcano iterator semijoin (WL#12470) This work by Steinar H. Gunderson implement all forms of semijoins in the iterator executor. This is a continuation of the work described in WL #12074.

Iterator executor analytics queries (WL#12788) This work by Steinar H. Gunderson broadens the scope of the analytics queries the iterator executor can handle, by supporting window functions, rollup, and final deduplication. This is a continuation of the work described in WL#12074 and WL#12470.

Character Sets

Add new binary collation for utf8mb4 (WL#13054) This work by Xing Zhang implements a new utf8mb4_0900_bin collation. The new collation is similar to the utf8mb4_bin collation with the difference that utf8mb4_0900_bin uses the utf8mb4 encoding bytes and does not add pad space.

Replication

Encrypt binary log caches at rest  (WL#12079) This work by Daogang Qu ensures that, when encrypting binary log files, we also encrypt temporary files created in cases when binary log caches spill to disk.

Allow compression when using mysqlbinlog against remote server (WL#2726) This work by Luís Soares enables protocol compression for mysqlbinlog. The user is now able to connect to a remote server using mysqlbinlog and request protocol compression support while transfering binary logs over the network.

Group Replication

Clone plugin integration on distributed recovery (WL#12827) This work by Pedro Gomes ensures that the user can start the group replication process in a new server and automatically clone the data from a donor and get up to speed without further intervention. This work makes use of the MySQL clone plugin and integrates it with Group Replication.

Cross-version policies (WL#12826)  This work by Jaideep Karande  defines the behavior and functional changes needed to maintain replication safety during group reconfigurations.

Router

MySQL 8.0.17 adds monitoring infrastructure and a monitoring REST interface to the MySQL Router. Applications and users who want to monitor the Router get structured access to configuration data, performance information, and resource usage. In addition, the MySQL Router has been further integrated with the MySQL Group Replication as it now handles view change notifications issued by the group replication protocol.

REST interface for Monitoring (WL#8965) This work by Jan Kneschke exposes data as REST endpoints via HTTP methods as JSON payload.

REST endpoints for service health (WL#11890) This work by Jan Kneschke adds REST endpoints for healthcheck, i.e. to check whether the router has backends available and that they are ready to accept connections. The  GET /routes/{routeName}/health returns an object with { “isActive”: true } if a route is able to handle client connections, { “isActive”: false } otherwise.

REST endpoints for metadata-cache  (WL#12441) This work by Jan Kneschke adds REST endpoints for the metadata-cache that expose current known cluster nodes and their state, success and failure counters, time of last fetch, and current configuration.

REST endpoints for routing (WL#12816)  This work by Jan Kneschke adds REST endpoints for routing such as the names of the *routes* the MySQL Router supports, the *configuration* of the route, the *status* information about the named route, blocked hosts, destinations, and connections.

REST endpoints for router application  (WL#12817) This work by Jan Kneschke adds REST endpoints for router status, i.e. the hostname, processId, productEdition, timeStarted and version.

Metadata cache invalidation via Group Replication Notification (WL#10719)   This work by Andrzej Religa extends the router to handle GR view change notifications. On reception of a GR view change notification from the xplugin the metadata cache will invalidate its cache for that cluster and trigger a refresh of the group status.

Basic xprotocol support for mysql_server_mock (WL#12861) This work by Andrzej Religa adds x protocol support to the mysql_server_mock program used as a dummy replacement for the mysqld server during component testing of the MySQL Router.

Notifications for xprotocol support for mysql_server_mock (WL#12905) This work by Andrzej Religa implements a way to mimic the GR notifications in mysql_server_mock for testing purposes. The mysql_server_mock is now able to mimic InnoDB Cluster nodes sending Notices to the Router.

MTR testsuite

Move testcases that need MyISAM to a separate .test file (WL#7407) This work by Mohit Joshi and Pooja Lamba moves the sections that need MyISAM to a separate .test file . This allows the MTR test suite to run on a server that is built without the MyISAM engine.

Other

Support host names longer than 60 characters (WL#12571)   This work by Gopal Shankar ensures that the server will be able to run with host names up to 255 characters. This work fixes  Bug#63814 and Bug#90601.

SHOW CREATE USER and CREATE USER  to work with HEX STRINGS for AUTH DATA  (WL#12803) This work by Georgi Kodinov implements  a new server option –print_identified_with_as_hex that causes SHOW CREATE USER to print hex chars for the password hash if the string is not printable (OFF by default).  The CREATE USER IDENTIFIED WITH AS and ALTER USER IDENTIFIED WITH AS will take hex literals for the password hash in addition to the string literals it currently takes regardless of the flag. See also Bug#90947.

Add mutex lock order checking to the server (WL#3262) This work by Marc Alff provides a methodology and tooling to enforce that the runtime execution is free of deadlocks.

Fix imbalance during parallel scan (WL#12978)  This work by Sunny Bains improves the parallel scan by further splitting of remaining partitions in cases where there are more partitions than there are worker threads. This is follow up work to WL#11720.

Control what plugins can be passed to –early-plugin-load (WL#12935) This work by Georgi Kodinov adds a new plugin flag to the PLUGIN_OPT_ALLOW_EARLY_LOAD flagset so that plugin authors can enable their plugin for –early-plugin-load. For pre-existing plugins this flag will be 0 (off), thus it is not an incompatible change. Also, all keyring plugins that we produce will be marked with this new flag as they must be loadable with –early-plugin-load.

Add OS User as Connection attribute in MySQL Client (WL#12955) This work by Georgi Kodinov adds a new connection attribute for “mysql” clients which adds information about the OS account mysql is executing as. This lets DBAs more easily notify people about who is running time consuming queries on the server. This is a contribution from Daniël van Eeden, see Bug#93916.

Added optional commenting of the @@GLOBAL.GTID_PURGED by dump (WL#12959) This work by Georgi Kodinov adds a new allowed value for the –set-gtid-purged command line argument to mysqldump. The –set-gtid-purged=COMMENTED will output the SET @GLOBAL.GTID_PURGED information in a comment. This is a contribution from Facebook, see Bug#94332.

A component service for the current_thd() (WL#12727)   This work by Georgi Kodinov makes it possible to call current_thd() from a component and in this way obtain an
opaque pointer to the THD that we can pass to other services. Calling current_thd() instead of using the global current_thd symbol from mysqld in plugins will contribute to cleaner plugins.

Deprecation and Removal

MySQL 8.0.17 does not remove any features but marks some features as deprecated in 8.0. Deprecated features will be removed in a future major release.

Deprecate/warn when using ‘everyone’ for named_pipe_full_access_group (WL#12670)  This work by Dan Blanchard ensures that the server raises and logs a warning message when the named_pipe_full_access_group system variable is set to a value that maps to the built in Windows Everyone group (SID S-1-1-0). We expect that in the future we will change the default value of the named_pipe_full_access_group system variable from ‘*everyone*’ to ” (i.e. no-one). See also WL#12445.

Deprecate BINARY keyword for specifying _bin collations (WL#13068) This work by Guilhem Bichot deprecates the BINARY keyword to specify that you want the *_bin
collation of a character set. This is not a standard SQL feature, just syntactic sugar that adds to the confusion between the BINARY data type and the binary “charset” or *_bin collations.

Deprecate integer display width and ZEROFILL option (WL#13127) This work by Knut Anders Hatlen deprecates the ZEROFILL attribute for numeric data types and the display width
attribute for integer types. See also Proposal to deprecate MySQL INTEGER display width and ZEROFILL by Morgan Tocker.

Deprecate unsigned attribute for DECIMAL and FLOAT data types (WL#12391) This work by Jon Olav Hauglid deprecates the UNSIGNED attribute for DECIMAL, DOUBLE and FLOAT data types. Unlike for the integer data types, the UNSIGNED attribute does not change the range for these data types, it simply means that it is impossible to insert negative values into the columns. As such, it is only a very simple check constraint, and using a general check constraint would be more consistent.

Deprecate && as synonym for AND and || as synonym for OR in SQL statements (WL#13070) This work by Guilhem Bichot adds a deprecation warning when && is used as a synonym for AND and || is used as a synonym for OR in SQL statements.

Deprecate AUTO_INCREMENT on DOUBLE and FLOAT (WL#12575) This work by Jon Olav Hauglid adds a deprecation warning when AUTO_INCREMENT is specified for DOUBLE and FLOAT columns.

Deprecate the ability to specify number of digits for floating point types (WL#12595) This work by  Jon Olav Hauglid adds a deprecation warning when the non-standard FLOAT(M,D) or REAL(M,D) or DOUBLE PRECISION(M,D) is specified.

Deprecate SQL_CALC_FOUND_ROWS and FOUND_ROWS  (WL#12615) This work by Steinar H. Gunderson adds a deprecation warning when the non-standard syntax SQL_CALC_FOUND_ROWS and FOUND_ROWS() is used.

Thank you for using MySQL!


MySQL Optimizer: Naughty Aberrations on Queries Combining WHERE, ORDER BY and LIMIT

$
0
0

Feed: Planet MySQL
;
Author: Jean-François Gagné
;

 | July 29, 2019 |  Posted In: MySQL

Sometimes, the MySQL Optimizer chooses a wrong plan, and a query that should execute in less than 0.1 second ends-up running for 12 minutes !  This is not a new problem: bugs about this can be traced back to 2014, and a blog post on this subject was published in 2015.  But even if this is old news, because this problem recently came yet again to my attention, and because this is still not fixed in MySQL 5.7 and 8.0, this is a subject worth writing about.

The MySQL Optimizer

Before looking at the problematic query, we have to say a few words about the optimizer.  The Query Optimizer is the part of query execution that chooses the query plan.  A Query Execution Plan is the way MySQL chooses to execute a specific query.  It includes index choices, join types, table query order, temporary table usage, sorting type …  You can get the execution plan for a specific query using the EXPLAIN command.

A Case in Question

Now that we know what are the Query Optimizer and a Query Execution Plan, I can introduce you to the table we are querying.  The SHOW CREATE TABLE for our table is below.

And this is not a small table (it is not very big either though…):

Now we are ready for the problematic query (I ran PAGER cat > /dev/null before to skip printing the result):

Hum, this query takes a long time (27.22 sec) considering that the table has an index on id1 and id2.  Let’s check the query execution plan:

What ? The query is not using the index key1, but is scanning the whole table (key: PRIMARY in above EXPLAIN) !  How can this be ?  The short explanation is that the optimizer thinks — or should I say hopes — that scanning the whole table (which is already sorted by the id field) will find the limited rows quick enough, and that this will avoid a sort operation.  So by trying to avoid a sort, the optimizer ends-up losing time scanning the table.

Some Solutions

How can we solve this ?  The first solution is to hint MySQL to use key1 as shown below. Now the query is almost instant, but this is not my favourite solution because if we drop the index, or if we change its name, the query will fail.

A more elegant, but still very hack-ish, solution is to prevent the optimizer from using an index for the ORDER BY.  This can be achieved with the modified ORDER BY clause below (thanks to Shlomi Noach for suggesting this solution on a MySQL Community Chat).  This is the solution I prefer so far, even if it is still somewhat a hack.

A third solution is to use the Late Row Lookups trick.  Even if the post about this trick is 10 years old, it is still useful — thanks to my colleague Michal Skrzypecki for bringing it to my attention.  This trick basically forces the optimizer to choose the good plan because the query is modified with the intention of making the plan explicit. This is an elegant hack, but as it makes the query more complicated to understand, I prefer not to use it.

The ideal solution…

Well, the best solution would be to fix the bugs below. I claim Bug#74602 is not fixed even if it is marked as such in the bug system, but I will not make too much noise about this as Bug#78612 also raises attention on this problem:

PS-4935 is a duplicate of PS-1653 that I opened a few months ago.  In that report, I mention a query that is taking 12 minutes because of a bad choice by the optimizer (when using the good plan, the query is taking less than 0.1 second).

One last thing before ending this post: I wrote above that I would give a longer explanation about the reason for this bad choice by the optimizer.  Well, this longer explanation has already been written by Domas Mituzas in 2015, so I am referring you to his on ORDER BY optimization post for more details.


Photo by Jamie Street on Unsplash

The content in this blog is provided in good faith by members of the open source community. The content is not edited or tested by Percona, and views expressed are the authors’ own. When using the advice from this or any other online resource test ideas before applying them to your production systems, and always secure a working back up.

Jean-François Gagné

Jean-François (J-F, JF or Jeff for short, not just Jean please) is a System/Infrastructure Engineer and MySQL Expert. He recently joined MessageBird, an IT telco startup in Amsterdam, with the mission of scaling the MySQL infrastructure. Before that, J-F worked on growing the Booking.com MySQL and MariaDB installations including dealing with replication bottlenecks (he also works on many other non MySQL related projects that are less relevant here). Some of his latest projects are making Parallel Replication run faster and promoting Binlog Servers. He also has a good understanding of replication in general and a respectable understanding of InnoDB, MySQL, Linux and TCP/IP. Before B.com, he worked as a System/Network/Storage Administrator in a Linux/VMWare environment, as an Architect for a Mobile Services Provider, and as a C and Java Programmer in an IT Service Company. Even before that, when he was learning computer science, Jeff studied cache consistency in distributed systems and network group communication protocols. Jean-François’ MySQL Blog | J-F’s LinkedIn Profile | Jeff’s Twitter Account

Forrester 2019 Enterprise BI Platform Wave™ Evaluations — Research Update

$
0
0

Feed: Planet big data.
Author: Boris Evelson.

Forrester has just published 2019 refreshes of our enterprise business intelligence (BI) platform Wave™ evaluations. As the BI market and the technology continue to evolve, so does our research. This year, we emphasized:

  • New market segmentation by both vendor-managed and client-managed platforms, which roughly equate to on-premises and cloud-based platforms, respectively, but not quite. Since both Wave evaluations used exactly the same evaluation criteria, we encourage readers to compare all vendors across both documents:
    • Client-managed enterprise BI platforms. In this segment, clients are fully responsible for deploying their private instance of the BI software. They may choose to install it on-premises, in a public cloud, or hosted by a vendor. But the client is ultimately responsible for the timing of upgrades and other software platform management decisions. Organizations that want to retain control over software upgrades and fixes should consider vendors in this category.
    • Vendor-managed enterprise BI platforms. In this segment, clients do not deploy but subscribe to software. A vendor maintains a single software instance and partitions it for logical private instances for each client. All clients are on the same software version, and all get the same continuous upgrades. Clients have no control over upgrades or other decisions. Organizations that are ready to completely shift software management responsibilities to the vendor should consider this category. Organizations must also be willing to use software deployed in a public cloud, as software in this category does not run on-premises.
  • Differentiated features and capabilities. BI technology is highly mature. Forrester considers many of the platforms’ features and capabilities, such as data connectivity, query management, data visualization, and OLAP instrumentation for slicing and dicing data, commoditized and table stakes. In this evaluation, we only considered differentiated features such as augmented BI (automated machine learning and conversational interface), platform extensibility and customization (using BI platforms as low-code app dev tools), capability to work with big data, advanced data visualization and location intelligence, and modern architecture (containerized, multitenant, serverless, etc.).
  • Top vendors only in a very crowded market. Forrester tracks ~100 vendors that claim to offer an enterprise BI platform. Over 40 made it into our 2019 vendor landscape: “Now Tech: Enterprise BI Platforms, Q1 2019.” The 20 vendors — 1010data, Amazon Web Services, Birst, Domo, IBM, Information Builders, Looker, Microsoft, MicroStrategy, OpenText, Oracle, Qlik, Salesforce, SAP, SAS, Sisense, Tableau Software, ThoughtSpot, TIBCO Software, and Yellowfin — reviewed in the two Wave evaluations represent the top 20% of the market, regardless of their Wave rankings.

Load ongoing data lake changes with AWS DMS and AWS Glue

$
0
0

Feed: AWS Big Data Blog.

Building a data lake on Amazon S3 provides an organization with countless benefits. It allows you to access diverse data sources, determine unique relationships, build AI/ML models to provide customized customer experiences, and accelerate the curation of new datasets for consumption. However, capturing and loading continuously changing updates from operational data stores—whether on-premises or on AWS—into a data lake can be time-consuming and difficult to manage.

The following post demonstrates how to deploy a solution that loads ongoing changes from popular database sources—such as Oracle, SQL Server, PostgreSQL, and MySQL—into your data lake. The solution streams new and changed data into Amazon S3. It also creates and updates appropriate data lake objects, providing a source-similar view of the data based on a schedule you configure. The AWS Glue Data Catalog then exposes the newly updated and de-duplicated data for analytics services to use.

Solution overview

I divide this solution into two AWS CloudFormation stacks. You can download the AWS CloudFormation templates I reference in this post from a public S3 bucket, or you can launch them using the links featured later. You can likewise download the AWS Glue jobs referenced later in this post.

The first stack contains reusable components. You only have to deploy it one time. It launches the following AWS resources:

  • AWS Glue jobs: Manages the workflow of the load process from the raw S3 files to the de-duped and optimized parquet files.
  • Amazon DynamoDB table: Persists the state of data load for each data lake table.
  • IAM role: Runs these services and accesses S3. This role contains policies with elevated privileges. Only attach this role to these services and not to IAM users or groups.
  • AWS DMS replication instance: Runs replication tasks to migrate ongoing changes via AWS DMS.

The second stack contains objects that you should deploy for each source you bring in to your data lake. It launches the following AWS resources:

  • AWS DMS replication task: Reads changes from the source database transaction logs for each table and stream that write data into an S3 bucket.
  • S3 buckets: Stores raw AWS DMS initial load and update objects, as well as query-optimized data lake objects.
  • AWS Glue trigger: Schedules the AWS Glue jobs.
  • AWS Glue crawler: Builds and updates the AWS Glue Data Catalog on a schedule.

Stack parameters

The AWS CloudFormation stack requires that you input parameters to configure the ingestion and transformation pipeline:

  • DMS source database configuration: The database connection settings that the DMS connection object needs, such as the DB engine, server, port, user, and password.
  • DMS task configuration: The settings the AWS DMS task needs, such as the replication instance ARN, table filter, schema filter, and the AWS DMS S3 bucket location. The table filter and schema filter allow you to choose which objects the replication task syncs.
  • Data lake configuration: The settings your stack passes to the AWS Glue job and crawler, such as the S3 data lake location, data lake database name, and run schedule.

Post-deployment

After you deploy the solution, the AWS CloudFormation template starts the DMS replication task and populates the DynamoDB controller table. Data does not propagate to your data lake until you review and update the DynamoDB controller table.

In the DynamoDB console, configure the following fields to control the data load process shown in the following table:

Field Description
ActiveFlag Required. When set to true, it enables this table for loading.
PrimaryKey A comma-separated list of column names. When set, the AWS Glue job uses these fields for processing update and delete transactions. When set to “null,” the AWS Glue job only processes inserts.
PartitionKey A comma-separated list of column names. When set, the AWS Glue job uses these fields to partition the output files into multiple subfolders in S3. Partitions can be valuable when querying and processing larger tables but may overcomplicate smaller tables. When set to “null,” the AWS Glue job only loads data into one partition.
LastFullLoadDate The data of the last full load. The AWS Glue job compares this to the date of the DMS-created full load file. Setting this field to an earlier value triggers AWS Glue to reprocess the full load file.
LastIncrementalFile The file name of the last incremental file. The AWS Glue job compares this to any new DMS-created incremental files. Setting this field to an earlier value triggers AWS Glue to reprocess any files with a larger name.

At this point, the setup is complete. At the next scheduled interval, the AWS Glue job processes any initial and incremental files and loads them into your data lake. At the next scheduled AWS Glue crawler run, AWS Glue loads the tables into the AWS Glue Data Catalog for use in your down-stream analytical applications.

Amazon Athena and Amazon Redshift

Your pipeline now automatically creates and updates tables. If you use Amazon Athena, you can begin to query these tables right away. If you use Amazon Redshift, you can expose these tables as an external schema and begin to query.

You can analyze these tables directly or join them to tables already in your data warehouse, or use them as inputs to an extract, transform, and load (ETL) process. For more information, see Creating External Schemas for Amazon Redshift Spectrum.

AWS Lake Formation

At the time of writing this post, AWS Lake Formation has been announced but not released. AWS Lake Formation makes it easy to set up a secure data lake. To incorporate Lake Formation in this solution, add the S3 location specified during launch as a “data lake storage” location and use Lake Formation to vend credentials to your IAM users.

AWS Lake Formation eliminates the need to grant S3 access via user, group, or bucket policies and instead provides a centralized console for granting and auditing access to your data lake.

Key features

A few built-in AWS CloudFormation key configurations make this solution possible. Understanding these features helps you replicate this strategy for other purposes or customize the application for your needs.

AWS DMS

  • The first AWS CloudFormation template deploys an AWS DMS replication instance. Before launching the second AWS CloudFormation template, ensure that the replication instance connects to your on-premises data source.
  • The AWS DMS endpoint for the S3 target has an extra connection attribute: addColumnName=true. This attribute tells DMS to add column headers to the output files. The process uses this header to build the metadata for the parquet files and the AWS Glue Data Catalog.
  • When the AWS DMS replication task begins, the initial load process writes files to the following location: s3:////
    /. It writes one file per table for the initial load named LOAD00000001.csv. It writes up to one file per minute for any data changes named .csv. The load process uses these file names to process new data incrementally.
  • The AWS DMS change data capture (CDC) process adds an additional field in the dataset “Op.” This field indicates the last operation for a given key. The change detection logic uses this field, along with the primary key stored in the DynamoDB table, to determine which operation to perform on the incoming data. The process passes this field along to your data lake, and you can see it when querying data.
  • The AWS CloudFormation template deploys two roles specific to DMS (DMS-CloudWatch-logs-role, DMS-VPC-role) that may already be in place if you previously used DMS. If the stack fails to build because of these roles, you can safely remove these roles from the template.
  • AWS Glue

    • AWS Glue has two types of jobs: Python shell and Apache Spark. The Python shell job allows you to run small tasks using a fraction of the compute resources and at a fraction of the cost. The Apache Spark job allows you to run medium- to large-sized tasks that are more compute- and memory-intensive by using a distributed processing framework. This solution uses the Python shell jobs to determine which files to process and to maintain the state in the DynamoDB table. It also uses Spark jobs for data processing and loading.
    • As changes stream in from your relational database, you may see new transactions appear as new files within a given folder. This load process behavior minimizes the impact on already loaded data. If this causes inconsistency in your file sizes or query performance, consider incorporating a compaction (file merging) process.
    • Between job runs, AWS Glue sequences duplicate transactions to the same primary key (for example, insert, then update) by file name and order. It determines the last transaction and uses it to re-write the impacted object to S3.
    • Configuration settings allow the Spark-type AWS Glue jobs a maximum of two DPUs of processing power. If your load jobs underperform, consider increasing this value. Increasing the job DPUs is most effective for tables set up with a partition key or when the DMS process generates multiple files between executions.
    • If your organization already has a long-running Amazon EMR cluster in place, consider replacing the AWS Glue jobs with Apache Spark jobs running within your EMR cluster to optimize your expenses.

    IAM

    • The solution deploys an IAM role named DMSCDC_Execution_Role. The role is attached to AWS services and is associated with AWS managed policies as well as an inline policy.
    • The AssumeRolePolicyDocument trust document for the role includes the following policies, which attach to the AWS Glue and AWS DMS services to ensure that the jobs have the necessary permissions to execute. AWS CloudFormation custom resources also use this role, backed by AWS Lambda, to initialize the environment.
         Principal :
           Service :
             - lambda.amazonaws.com
             - glue.amazonaws.com
             - dms.amazonaws.com
         Action :
           - sts:AssumeRole
      
    • The IAM role includes the following AWS managed policies. For more information, see Managed Policies and Inline Policies.
      ManagedPolicyArns:
           - arn:aws:iam::aws:policy/service-role/AWSGlueServiceRole
           - arn:aws:iam::aws:policy/AmazonS3FullAccess
           - arn:aws:iam::aws:policy/service-role/AWSLambdaVPCAccessExecutionRole
    • The IAM role includes the following inline policy. This policy includes permissions to execute the Lambda-backed AWS CloudFormation custom resources, initialize and manage the DynamoDB table, and initialize the DMS replication task.
         Action:
           - lambda:InvokeFunction
           - dynamodb:PutItem
           - dynamodb:CreateTable
           - dynamodb:UpdateItem
           - dynamodb:UpdateTable
           - dynamodb:GetItem
           - dynamodb:DescribeTable
           - iam:GetRole
           - iam:PassRole
           - dms:StartReplicationTask
           - dms:TestConnection
           - dms:StopReplicationTask
         Resource:
           - arn:aws:dynamodb:${AWS::Region}:${AWS::Account}:table/DMSCDC_*
           - arn:aws:lambda:${AWS::Region}:${AWS::Account}:function:DMSCDC_*
           - arn:aws:iam::${AWS::Account}:role/DMSCDC_*
           - arn:aws:dms:${AWS::Region}:${AWS::Account}:*:*"
         Action:
           - dms:DescribeConnections
           - dms:DescribeReplicationTasks
         Resource: '*'

    Sample database

    The following example illustrates what you see after deploying this solution using a sample database.

    The sample database includes three tables: product, store, and productorder. After deploying the AWS CloudFormation templates, you should see a folder created for each table in your raw S3 bucket.

    Each folder contains an initial load file.

    The table list populates the DynamoDB table.

    Set the active flag, primary key, and partition key values for these tables. In this example, I set the primary key for the product and store tables to ensure it processes the updates. I leave the primary key for the productorder table alone, because I do not expect update transactions. However, I set the partition key to ensure it partitions data by date.

    When the next scheduled AWS Glue job runs, it creates a folder for each table in your data lake S3 bucket.

    When the next scheduled AWS Glue crawler runs, your AWS Glue Data Catalog lists these tables. You can now query them using Athena.

    Similarly, you can query the data lake from within your Amazon Redshift cluster after first cataloging the external database.

    On subsequent AWS Glue job runs, the process compares the timestamp of the initial file with the “LastFullLoadDate” field in the DynamoDB table to determine if it should process the initial file again. It also compares the new incremental file names with the “LastIncrementalFile” field in the DynamoDB table to determine if it should process any incremental files. In the following example, it created a new incremental file for the product table.

    Examining the file shows two transactions: an update and a delete.

    When the AWS Glue job runs again, the DynamoDB table updates to list a new value for the “LastIncrementalFile.”

    Finally, the solution reprocesses the parquet file. You can query the data to see the new values for the updated record and ensure that it removes the deleted record.

    Summary

    In this post, I provided a set of AWS CloudFormation templates that allow you to quickly and easily sync transactional databases with your AWS data lake. With data in your AWS data lake, you can perform analysis on data from multiple data sources, build machine learning models, and produce rich analytics for your data consumers.

    If you have questions or suggestions, please comment below.


    About the Author

    Rajiv Gupta is a data warehouse specialist solutions architect with Amazon Web Services.

Sven Klemm: OrderedAppend: An optimization for range partitioning

$
0
0

Feed: Planet PostgreSQL.

With this feature, we’ve seen up to 100x performance improvements for certain queries.

In our previous post on implementing constraint exclusion, we discussed how TimescaleDB leverages PostgreSQL’s foundation and expands on its capabilities to improve performance. Continuing with the same theme, in this post we will discuss how we’ve added support for ordered appends which optimize a large range of queries, particularly those that are ordered by time.

We’ve seen performance improvements up to 100x for certain queries after applying this feature, so we encourage you to keep reading!

Optimizing Appends for large queries

PostgreSQL represents how plans should be executed using “nodes”. There are a variety of different nodes that may appear in an EXPLAIN output, but we want to focus specifically on Append nodes, which essentially combine the results from multiple sources into a single result.

PostgreSQL has two standard Appends that are commonly used that you can find in an EXPLAIN output:

  • Append: appends results of child nodes to return a unioned result
  • MergeAppend: merge output of child nodes by sort key; all child nodes must be sorted by that same sort key; accesses every chunk when used in TimescaleDB

When MergeAppend nodes are used with TimescaleDB, we necessarily access every chunk to figure out if the chunk has keys that we need to merge. However, this is obviously less efficient since it requires us to touch every chunk.

To address this issue, with the release of TimescaleDB 1.2 we introduced OrderedAppend as an optimization for range partitioning. The purpose of this feature is to optimize a large range of queries, particularly those that are ordered by time and contain a LIMIT clause. This optimization takes advantage of the fact that we know the range of time held in each chunk, and can stop accessing chunks once we’ve found enough rows to satisfy the LIMIT clause. As mentioned above, with this optimization we see performance improvements of up to 100x depending on the query.

With the release of TimescaleDB 1.4, we wanted to extend the cases in which OrderedAppend can be used. This meant making OrderedAppend space-partition aware, as well as removing the LIMIT clause restriction from Ordered Append. With these additions, more users can benefit from the performance benefits achieved through leveraging OrderedAppend.

(Additionally, the updates to OrderedAppend for space partitions will be leveraged even more heavily with the release of TimescaleDB clustering which is currently in private beta. Stay tuned for more information!)

Developing query plans with the optimization

As an optimization for range partitioning, OrderedAppend eliminates sort steps because it is aware of the way data is partitioned.

Since each chunk has a known time range it covers to get sorted output, no global sort step is needed. Only local sort steps have to be completed and then appended in the correct order. If index scans are utilized, which return the output sorted, sorting can be completely avoided.

For a query ordering by the time dimension with a LIMIT clause you would normally get something like this:

dev=# EXPLAIN (ANALYZE,COSTS OFF,BUFFERS,TIMING OFF,SUMMARY OFF)
dev-# SELECT * FROM metrics ORDER BY time LIMIT 1;
                                                 QUERY PLAN
------------------------------------------------------------------------------------------------------------
 Limit (actual rows=1 loops=1)
   Buffers: shared hit=16
   ->  Merge Append (actual rows=1 loops=1)
         Sort Key: metrics."time"
         Buffers: shared hit=16
         ->  Index Scan using metrics_time_idx on metrics (actual rows=0 loops=1)
               Buffers: shared hit=1
         ->  Index Scan using _hyper_1_1_chunk_metrics_time_idx on _hyper_1_1_chunk (actual rows=1 loops=1)
               Buffers: shared hit=3
         ->  Index Scan using _hyper_1_2_chunk_metrics_time_idx on _hyper_1_2_chunk (actual rows=1 loops=1)
               Buffers: shared hit=3
         ->  Index Scan using _hyper_1_3_chunk_metrics_time_idx on _hyper_1_3_chunk (actual rows=1 loops=1)
               Buffers: shared hit=3
         ->  Index Scan using _hyper_1_4_chunk_metrics_time_idx on _hyper_1_4_chunk (actual rows=1 loops=1)
               Buffers: shared hit=3
         ->  Index Scan using _hyper_1_5_chunk_metrics_time_idx on _hyper_1_5_chunk (actual rows=1 loops=1)
               Buffers: shared hit=3

You can see 3 pages are read from every chunk and an additional page from the parent table which contains no actual rows.

While with this optimization enabled you would get a plan looking like this:

dev=# EXPLAIN (ANALYZE,COSTS OFF,BUFFERS,TIMING OFF,SUMMARY OFF)
dev-# SELECT * FROM metrics ORDER BY time LIMIT 1;
                                                 QUERY PLAN
------------------------------------------------------------------------------------------------------------
 Limit (actual rows=1 loops=1)
   Buffers: shared hit=3
   ->  Custom Scan (ChunkAppend) on metrics (actual rows=1 loops=1)
         Order: metrics."time"
         Buffers: shared hit=3
         ->  Index Scan using _hyper_1_1_chunk_metrics_time_idx on _hyper_1_1_chunk (actual rows=1 loops=1)
               Buffers: shared hit=3
         ->  Index Scan using _hyper_1_2_chunk_metrics_time_idx on _hyper_1_2_chunk (never executed)
         ->  Index Scan using _hyper_1_3_chunk_metrics_time_idx on _hyper_1_3_chunk (never executed)
         ->  Index Scan using _hyper_1_4_chunk_metrics_time_idx on _hyper_1_4_chunk (never executed)
         ->  Index Scan using _hyper_1_5_chunk_metrics_time_idx on _hyper_1_5_chunk (never executed)

After the first chunk, the remaining chunks never get executed and to complete the query only 3 pages have to be read. TimescaleDB removes parent tables from plans like this because we know the parent table does not contain any data.

MergeAppend vs. ChunkAppend

The main difference between these two examples is the type of Append node we used. In the first case, a MergeAppend node is used. In the second case, we used a ChunkAppend node (also introduced in 1.4) which is a TimescaleDB custom node that works similarly to the PostgreSQL Append node, but contains additional optimizations.

The MergeAppend node implements the global sort and requires locally sorted input which has to be sorted by the same sort key. To produce one tuple, the MergeAppend node has to read one tuple from every chunk to decide which one to return to.

For the very simple example query above, you will see 16 pages read (with MergeAppend) vs. 3 pages (with ChunkAppend) which is a 5x improvement over the unoptimized case (if we ignore the single page from the parent table), and represents the number of chunks present in that hypertable. So for a hypertable with 100 chunks, there would be 100 times less pages to be read to produce the result for the query.

As you can see, you gain the most benefit from OrderedAppend with a LIMIT clause as older chunks don’t have to be touched if the required results can be satisfied from more recent chunks. This type of query is very common in time-series workloads (e.g. if you want to get the last reading from a sensor). However, even for queries without a LIMIT clause, this feature is beneficial because it eliminates sorting of data.

If you are interested in using OrderedAppend, make sure you have TimescaleDB 1.2 or higher installed (installation guide). However, we always recommend upgrading to the most recent version of the software (at the time of publishing this post, it’s TimescaleDB 1.4).

If you are brand new to TimescaleDB, get started here. Have questions? Join our Slack channel or leave them in the comments section below.

How to Format an External Hard Drive the Easy Way in 2019

$
0
0

Feed: Cloudwards.
Author: Jacob Roach
;

If you’ve run into issues with your hard drive, formatting is one of the first steps you should take to troubleshoot it. Formatting allows you to overwrite all data on the hard drive, resetting the file structure and how the drive interacts with the operating system. It can also be used to prep a hard drive for use with another OS. 

In this guide on how to format an external hard drive, we’re going to help you make sure your portable disk works with everything. We’ll show you how to format your hard drive on Windows and macOS and explain the key settings on each OS. 

Before getting to that, though, it’s important to understand what hard drive formatting is. Let’s talk about hard drive formatting, file systems and how formatting doesn’t necessarily erase all data from your hard drive first.

What is Hard Drive Formatting?

Most people associate hard drive formatting with erasing a hard drive. Though that’s true to a degree, it’s not the sole purpose of the process. Instead, formatting is used to get the hard drive to a state in which it can be used by the computer, which requires all written data to be erased from the drive. 

what-is-hard-drive-formatting

The data isn’t erased completely, but we’ll touch more on that later. Most external hard drives come ready to use on your computer, but in rare cases, you’ll need to format your hard drive. In fact, that’s one of our recommended troubleshooting steps in our how to solve an external hard drive not showing up guide. 

Outside of formatting for initial use, you may need to reformat your hard drive if you encounter errors. In the same way a fresh install of your OS can solve most issues, reformatting your hard drive is a critical step in troubleshooting problems. Just be sure your data is backed up with an online backup service, such as Backblaze, beforehand (read our Backblaze review). 

Before getting into the formatting process, though, it’s important to go over what you’ll be formatting the hard drive with: a file system.

File Systems

File systems are what operating systems use to store data on a storage device. Unfortunately, there isn’t a de facto file system that all hard drives use. The one yours uses largely depends on the drive and the OS you’re using. Because of that, we’re going to go over the most commonly used file systems so you’ll know what’s what.

  • NTFS: NTFS is what Windows uses by default. Like most file systems, it’s restricted once you move outside of Windows. You can read and write on Windows platforms, but macOS and Linux users will only be able to read data from an NTFS-formatted drive. 
  • ExFAT: ExFAT isn’t exclusive to any OS. Windows and macOS can read and write data to it. Though not as prevalent as NTFS, you’ll often find flash drives and external solid-state drives formatted to ExFAT out of the box because multi-platform support and the lack of file size restrictions make it an ideal choice for plug-and-play setups. 
  • FAT32: FAT32 is the older, uglier cousin of ExFAT. Like that file system, it works across Linux, Windows and macOS, and in years past, it was the de facto option for flash drives. It can’t store files larger than 4GB, though, so it has fallen out of favor in recent years. 
  • HFS Plus: Similar to how NTFS is default file system for Windows, HFS Plus is the default file system for macOS. It’s limited on Windows machines, but Apple users will be able to read and write to HFS Plus-formatted drives without issues.

We hope it’s clear now why understanding file systems is important. If you’ve checked out a sideloading guide, such as our Kodi sideloading guide, you probably saw recommendations to format to ExFAT or FAT32. That’s because those file systems work across platforms while NTFS and HFS Plus don’t.

Whichever file system your hard drive shipped with is what you have to use if you don’t want to remove all data from the drive. Alternatively, you could dump the data on your drive to a cloud storage service, such as Sync.com, format the drive and put your data back on it (read our Sync.com review).

How to Format an External Hard Drive

Now that we have formatting and file system basics out of the way, it’s time to show you how to format an external hard drive. We’ll show you how to do it on Windows and macOS using the Samsung T5, which is one of the best external hard drives, as you can see in our Samsung T5 review

We chose the T5 because it’s formatted to ExFAT out of the box, meaning it works with Windows and macOS straight away. 

How to Format an External Hard Drive on Windows

Formatting a hard drive on Windows is a simple affair, especially if you leave everything as default. That said, if you want to change settings, you’ll need to know the details of each.


Before getting to those, you have to find the hard drive you want to format by following these steps.

 
  1. Open File Explorer
  2. Navigate to “my PC”
  3. Right-click the drive you want to format
  4. Click “format” 

Windows will then open the formatting wizard. We’re going to run through each setting in the wizard so you know which settings you need to change. 

  • Capacity: This shows the capacity of the drive. There’s a drop-down, but the full capacity of the drive is usually the only option unless you have partitions set up. If that sounds like gibberish, leave the setting on the default option. 
  • File System: This is the file system you want to format the drive to. There’s a default file system — usually NTFS for internal drives and ExFAT for external — so it’s best to leave that. If you want to change the file system, you can do so here. It’s important to note, though, that internal drives can only be formatted to NTFS. 
  • Allocation Unit Size: The allocation unit size is how large each storage block is on the drive. In almost all cases, leaving the setting on its default is the best option, but you can read up on the math behind it if you’re trying to optimize your drive.
  • Volume Label: This is what you want the drive to be named after it has been formatted. If it’s unnamed, Windows will automatically assign it a name. 
  • Quick Format: The quick format box is toggled by default. That means Windows will delete the file structure of the drive, though the data is still accessible if you use hard drive forensics tools. Doing a full format takes longer, but it’ll overwrite your data and scan for bad sectors.

Though we went over the settings, the best thing to do is probably to leave them on their defaults. Once everything is set, all you need to do is click “start” and wait for the progress bar to fill.

How to Format an External Hard Drive on macOS

Formatting, and dealing with hard drive-related matters in general, is easy in macOS. Unlike Windows, macOS gives you the tools to format, partition, restore and repair your hard drive from a single screen that can be found in your utilities.


To find the screen, follow these steps.

 
  1. Open Finder
  2. Follow the path /applications/utilities and click “disk utility”
  3. Find your drive in the left-side menu and click it
  4. Click the “erase” tab on the main screen
  5. Select the file system you want to use and give the drive a name

After that, you’re done. macOS doesn’t give you as much control as Windows does, but as we explained, much of that control is irrelevant. The formatting process is simple, with Apple going as far as including step-by-step instruction above the options. 

The only thing you may need to pay attention to is the security options. By default, macOS formats your drive the same way that a quick format does on Windows, meaning the file structure is erased, but the binary data is still there. You can fully erase the data by using the security options. 

How to Fully Erase an External Hard Drive

As mentioned throughout this guide, formatting your hard drive doesn’t erase all the data from it. Binary data needs to be written to the drive at all times, so instead of removing it, your OS deletes the file structure, meaning you can’t access the data on your drive.


For all intents and purposes, your data is erased. You can write new data to the drive, and your OS will show that all the space is available. If you’re disposing of a hard drive, though, someone can still access the data using a forensics tool. Essentially, those tools allow people to bypass the structure of the OS and piece together the files using the binary data. 

As we said, the hard drive always needs to be filled with binary data. The only way to fully erase your data is to overwrite what’s there with new binary data. Though the built-in utilities on Windows and macOS help in parts, a hacker could reverse engineer the process to find the data on the drive. 

There are few options to fully remove data. If you’re getting rid of the drive, a classic solution is to tap it a few times with a hammer to break the disks inside before recycling. If you need to remove data quickly and still want the drive to function, though, you’ll need a separate utility. 

One of the most common is Darik’s Boot and Nuke. It’s an open-source project that rewrites the data on your drive using random processes to ensure it isn’t recoverable. You can boot to DBAN instead of your OS to start the process, which is ideal if you’re recycling or selling your computer.

Final Thoughts

We hope we’ve explained the differences between formatting and erasing an external hard drive.. Formatting isn’t only used to get rid of data on a drive. It’s also used to make a drive compatible with a different OS. The Western Digital My Book, for example, comes formatted to NTFS, but you can reformat it to ExFAT for use with macOS (read our Western Digital My Book review). 

Sign up for our newsletter
to get the latest on new releases and more.

If you’re looking to add to your external hard drive repertoire, read our external hard drive reviews. There, you’ll find our favorite portable disks, including the SanDisk Extreme Portable SSD (read our SanDisk Extreme Portable review). 

Why do you need to format your drive? Do you have any more questions on the process? Let us know in the comments and, as always, thanks for reading. 


How to Solve an External Hard Drive Not Showing Up in 2019

$
0
0

Feed: Cloudwards.
Author: Jacob Roach
;

No matter how extensively we test our best external hard drives for errors, some units will have problems. It’s the nature of the beast, unfortunately, and though it can be disappointing to see nothing after unboxing your shiny, new external hard drive, the solution is likely only a few clicks away. 

In this guide on how to solve an external hard drive not showing up, we’re going to go over the major troubleshooting steps you should take before returning your disk. The steps are mostly the same for Windows and macOS, but we’ve covered both so you don’t get lost. 

Before getting to that, though, we want to discuss the reasons your hard drive may not be showing up.

Why Your External Hard Drive Isn’t Showing Up

If your external hard drive isn’t showing up, many things could be causing the issue, including problems with your computer, a hard drive that’s dead on arrival, a fault cable and more. That said, there are usually reasons in your operating system that can cause a hard drive not to show. 

Hard drives associate with computers using what’s known as file systems, which you can learn about in our how to format an external hard drive guide. Sometimes, those systems, or even the file structure, get out of sorts, causing the OS to not recognize the drive, which can be further complicated with drivers. 

That said, the most likely issue is that your hard drive isn’t ready to be used with your OS. It can get messy, but in some cases, you’ll need to dig into the guts of your OS and configure your external hard drive. In fact, we needed to do that when we tested the Western Digital My Book on macOS (read our Western Digital My Book review).

How to Solve an External Hard Drive Not Showing Up on Windows

Windows includes multiple tools for diagnosing a hard drive, but it, unfortunately, makes them difficult to access. We’re going to run through the steps you should take if your hard drive isn’t showing up on Windows. 

Check the Power, Cable and Port

Before getting to Windows, you should check the power, cable and port. Power on your computer and plug in the external hard drive. Most hard drives, such as the Seagate Backup Plus Portable, include an activity LED that tells you if the drive is operating (read our Seagate Backup Plus Portable review).

If your external hard drive doesn’t have an activity LED, you can feel the drive for vibrations. Though that works with a spinning disk, such as the Toshiba Canvio Basics, it won’t work with an SSD, such as the SanDisk Extreme Portable (read our Toshiba Canvio Basics review and SanDisk Extreme Portable review). 

Now that you know that the drive is receiving power, you can move on to the cable and port. It’s possible the USB cable you’re using is broken, so swap in a new cable and try again. The same goes for the USB port you’re using. Move the connection to different ports or computers to troubleshoot. 

Doing those things will solve most issues. If you’re still having problems, though, something has gone awry in your OS. 

Run Disk Management

It’s time to move on to disk management. After confirming the port, cable and hard drive are fine, plug your external hard drive into your computer and turn on the machine. Once in Windows, there are a few ways to access disk management, but the easiest is pressing Windows Key + X and selecting “disk management” from the list.

macos-disk-utility

There, you can see the hard drives plugged into your computer, their capacities, free space, file systems and health statuses. Even if your hard drive isn’t showing up in “my PC,” it should show up in “disk management.” As mentioned, many issues with hard drives not showing up come down to unallocated space, meaning the hard drive isn’t ready to be used with the OS. 

If you don’t see your hard drive there, something is wrong with your cable, port or power, so you should try to take advantage of the warranty and replace your hard drive. If you see your hard drive, though, and it’s unallocated, you’ll need to create a few partitions or, in some cases, format the drive.

Create a Partition or Format the Drive

Unallocated hard drive space means the storage space on the hard drive isn’t formatted with a file system that can be read by your OS. Windows will recognize the drive is there, but it won’t show it in “my PC” or allow you to read or write data. 

To fix that, you’ll need to create a partition in “disk management.” In the window on the bottom of the “disk management” panel, find your hard drive. A portion of the storage should be displayed with a black bar on top, indicating that it’s unallocated space. Right-click and select “new simple volume.” 

The partition wizard will launch and, for the most part, all you need to do is follow the steps. It’s worth noting that adding a new partition will format the drive, removing all data on it. If your hard drive is showing unallocated space, though, it’s likely no data was on it to begin with. 

In the unlikely event that you went to “disk management” and found that your external hard drive doesn’t have unallocated space, a format can help. It’s possible there were errors when formatting the drive at the factory, making your external hard drive inaccessible. Find your hard drive in disk management, click the portion with a blue bar on top and click “format.” 

If you’re curious about the formatting process, read our guide linked above. 

Update the Drivers

If you’ve gone through everything else and your hard drive still isn’t showing up, it could just be a driver issue. You can find driver information by pressing Windows Key + S and typing “device manager.” The top result should open the “device manager” window. 


There, navigate to “disk drive” and expand the drop-down. Find the drive that isn’t showing up and double-click it. A separate window will pop up with multiple tabs. Navigate to the “driver” tab to view the driver information. 

Your driver information will likely look out of date, but that isn’t the problem. Windows comes with the drivers necessary to detect external hard drives, which rarely need to be updated. That said, you may need to update yours. Click the “update driver” button to get started. 

You’ll be presented with two options: search online for the driver or browse your computer for it. You can search if you want, but it’s unlikely you’ll find anything. It’s a better idea to find your product on the manufacturer’s website and see if new drivers have been released.

How to Get an External HD to Show Up on Windows

  1. Check the power, cable and port
  2. Run disk management
  3. Format the drive or create a partition
  4. Update the drivers

How to Solve an External Hard Drive Not Showing Up on macOS

As is usually the case, macOS trades power for usability. You don’t get nearly as many tools to diagnose your drive, but they’re much easier to access. Follow the steps below to find your external hard drive on macOS. 

Check the Power, Cable and Port

As with Windows, you need to start troubleshooting before your Mac even boots. Check the power of the drive by looking for the LED drive indicator or by feeling the hard drive after you’ve plugged it in. If you’re using a drive with an external power source, such as the Western Digital My Book, try different outlets. 

Next, move on to your cable and USB port. Try these points in the chain separately, though. For example, swap a USB cable using the same port, then try both cables with a different port.

Though all that seems like common sense, most issues come from problems with the cable or port. It’s important to systematically troubleshoot them using every combination possible to narrow down what could be ruining the chain.

Use Apple’s Disk Utility

Now that you know it’s not the cable, drive or port, it’s time to see if the drive is recognized by macOS. It’s possible that your computer recognizes the drive, despite the fact that it’s not showing up. You can find out if that’s the case using Apple’s “disk utility.”


There are a few ways to access it, but the best way is to search for it using “spotlight.” Once you’re in “disk utility,” you should be able to see your hard drives, with the internal and external drives being separated. Click the drive that isn’t showing up, and at the top, select “mount” for it to show up in “finder.” 

If you’re having issues mounting or the drive won’t show up, it’s possible that the file system the drive is formatted to is causing problems for macOS. Some external hard drives come formatted to NTFS, which is the default file system for Windows. That can cause trouble for macOS users.

Format the Drive

If your drive still isn’t showing, you can format it in “disk utility.” Select your drive and use the “format” tab at the top to open the utility. Once again, if you’re stuck, you can use our guide linked above for extended instructions.


There are a few reasons you’d need to format your drive. As mentioned, it may be formatted with the incorrect file system, meaning you’ll need to format it to APFS to use it with macOS 10.13 or later. There are variations of the default Apple file system, which you can learn about here

That said, even if your drive is formatted with the correct file system, it’s possible there were errors when it was formatted at the factory. In that case, it’s a good idea to run a format anyway. Be warned that formatting will erase everything on the drive, though, so be sure you’re protected with our best cloud backup for Macs.

Reset NVRAM

Lastly, you can reset the nonvolatile random-access memory, or NVRAM. Macs use a small amount of memory to store certain user settings that can be accessed quickly, including sound volume, timezone, display resolution and, most important, startup-disk selection. Resetting your NVRAM will erase these settings, defaulting to whatever the computer shipped with. 

Your files won’t be affected, so there’s no need to worry there. Think of resetting your NVRAM as flushing faulty settings from your system and having them automatically rebuilt for you. 

It’s simple to do. Power down your Mac, then turn it back on. Right after you turn it on, press Option, Command, P and R simultaneously for 20-30 seconds. Your Mac will appear to restart, and once you hear the start-up chime, you can release the keys. With that, your NVRAM have been reset.

How to Get an External HD to Show Up on Mac

  1. Check the power, cable and port
  2. Run disk utility
  3. Format the drive
  4. Reset NVRAM

Final Thoughts

Those are the major troubleshooting steps you should go through if your hard drive isn’t showing up. If after doing all the steps you’re still having problems, the issue is much deeper in the OS or at the hard drive level. If you’re in that position, you could do a fresh install of your OS or take advantage of your external hard drive’s warranty.

Sign up for our newsletter
to get the latest on new releases and more.

Thankfully, you shouldn’t run into that issue too often, especially if you’re using a disk rated highly in our external hard drive reviews

Was your issue solved? What was the solution? Let us know in the comments below and, as always, thanks for reading. 

Fun with Bugs #87 – On MySQL Bug Reports I am Subscribed to, Part XXI

$
0
0

Feed: Planet MySQL
;
Author: Valeriy Kravchuk
;

After a 3 months long break I’d like to continue reviewing MySQL bug reports that I am subscribed to. This issue is devoted to bug reports I’ve considered interesting to follow in May, 2019:

  • Bug #95215 – “Memory lifetime of variables between check and update incorrectly managed“. As demonstrated by Manuel Ung, there is a problem with all InnoDB MYSQL_SYSVAR_STR variables that can be dynamically updated. Valgrind allows to highlight it.
  • Bug #95218 – “Virtual generated column altered unexpectedly when table definition changed“. This weird bug (that does not seem to be repeatable on MariaDB 10.3.7 with proper test case modifications like removing NOT NULL and collation settings from virtual column) was reported by Joseph Choi. Unfortunately we do not see any documented attempt to check if MySQL 8.0.x is also affected. My quick test shows MySQL 8.0.17 is NOT affected, but I’d prefer to see check copy/pasted as a public comment to the bug.
  • Bug #95230 – “SELECT … FOR UPDATE on a gap in repeatable read should be exclusive lock“. There are more chances to get a deadlock with InnoDB than one might expect… I doubt this report from Domas Mituzas is a feature request. It took him some extra efforts to insist on the point and get it verified even as S4.
  • Bug #95231 – “LOCK=SHARED rejected contrary to specification“. This bug report from Monty Solomon ended up as a documentation request. The documentation and the implementation are not aligned, and it was decided NOT to change the parser to match documented syntax. But why it is still “Verified” then? Should it take months to correct the fine manual?
  • Bug #95232 – “The text of error message 1846 and the online DDL doc table should be updated”. Yet another bug report from Monty Solomon. Some (but not ALL) partition specific ALTER TABLE operations do not yet support LOCK clause.
  • Bug #95233 – “check constraint doesn’t consider IF function that returns boolean a boolean fun“. As pointed out by Daniel Black, IF() function in a check constraint isn’t considered a boolean type. He had contributed a patch to fix this, but based on comments it’s not clear if it’s going to be accepted and used “as is”. The following test shows that MariaDB 10.3 is not affected:

    C:Program FilesMariaDB 10.3bin>mysql -uroot -proot -P3316 test
    Welcome to the MariaDB monitor.  Commands end with ; or g.
    Your MariaDB connection id is 9
    Server version: 10.3.7-MariaDB-log mariadb.org binary distribution

    Copyright (c) 2000, 2018, Oracle, MariaDB Corporation Ab and others.

    Type ‘help;’ or ‘h’ for help. Type ‘c’ to clear the current input statement.
    MariaDB [test]> create table t1 (source enum(‘comment’,’post’) NOT NULL, comment_id int unsigned, post_id int unsigned);
    Query OK, 0 rows affected (0.751 sec)

    MariaDB [test]> alter table t1 add check(IF(source = ‘comment’, comment_id IS NOT NULL AND post_id IS NULL, post_id IS NOT NULL AND comment_id IS NULL));
    Query OK, 0 rows affected (1.239 sec)
    Records: 0  Duplicates: 0  Warnings: 0

  • Bug #95235 – “ABRT:Can’t generate a unique log-filename binlog.(1-999), while rotating the bin“. Yet another bug report from Daniel Black. When MySQL 8.0.16 is built with gcc 9.0.x abort is triggered in the MTR suite on the binlog.binlog_restart_server_with_exhausted_index_value test.
  • Bug #95249 – “stop slave permanently blocked“. This bug was reported by Wei Zhao, who had contributed a patch.
  • Bug #95256 – “MySQL 8.0.16 SYSTEM USER can be changed by DML“. MySQL 8.0.16 had introduced an new privilege, SYSTEM_USER. MySQL manual actually says:

    The protection against modification by regular accounts that
    is afforded to system accounts by the
    SYSTEM_USER privilege does
    not apply to regular accounts that have privileges on the
    mysql system schema and thus can directly
    modify the grant tables in that schema. For full protection,
    do not grant mysql schema privileges to
    regular accounts.

    But the report that a user with a privilege to execute DML on the mysql.GLOBAL_GRANTS table from Zhao Jianwei was accepted and verified. I hope Oracle engineers will finally make up their mind and decide either to fix this or to close this report as “Not a bug”. I’ve subscribed in a hope for some fun around this decision making.

  • Bug #95269 – “binlog_row_image=minimal causes assertion failure“. This assertion failure happens in debug build when one of standard MTR test cases, rpl.rpl_gis_ddl or rpl.rpl_window_functions is executed with –binlog-row-image=minimal option. In such cases I always wonder what is the reason for a failure NOT to be noted by Oracle MySQL QA and somehow fixed before Community users notice it? Either they don’t run tests on debug builds with all possible combinations, or do not care to fix such failures (and thus should suffer from known failures in other test runs). I do not like any of these options, honestly. The bug was reported by Song Libing.
  • Bug #95272 – “Potential InnoDB SPATIAL INDEX corruption during root page split“. This bug was reported by Albert Hu based on Valgrind report when running the test innodb.instant_alter. Do they run MTR tests under on Valgrind or ASan builds in Oracle? I assume they do, but then why Community users are reporting such cases first? Note that related MariaDB’s bug, MDEV-13942, is fixed in 10.2.24+ and 10.3.15+.
  • Bug #95285 – “InnoDB: Page [page id: space=1337, page number=39] still fixed or dirty“. This assertion failure that happens during normal shutdown was reported by LUCA TRUFFARELLI. There are chances that this is a regression bug (without a regression tag), as it does not happen for reporter on MySQL 5.7.21.
  • Bug #95319 – “SHOW SLAVE HOST coalesces certain server_id’s into one“. This bug was reported by Lalit Choudhary from Percona based on original findings by Glyn Astill.
  • Bug #95416 – “ZERO Date is both NULL and NOT NULL“. This funny bug report was submitted Morgan Tocker. Manual actually explains that it’s intended behavior (MariaDB 10.3.7 works the same way as MySQL), but it’s still funny and unexpected, and the bug report remains “Verified”.
  • Bug #95478 – “CREATE TABLE LIKE does not honour ROW_FORMAT.” I’d like to add “…when it was not defined explicitly for the original table”. The problem was reported by Jean-François Gagné and ended up as a verified feature request. See also this my post on the details of where row_format is stored and is not stored for InnoDB tables…
  • Bug #95484 – “EXCHANGE PARTITION works wrong/werid with different ROW_FORMAT“. Another bug report by Jean-François Gagné related to the previous one. He had shown that it’s actually possible to get partitions with different row formats in the same InnoDB table in MySQL 5.7.26, but not in the most natural way. It seems the problem may be fixed in 5.7.27 (by the fix for another, internally reported bug), but the bug remains “Verified”.

There are some more bugs reported in May 2019 that I was interested in, but let me stop for now. Later in May I’ve got a chance to spend some days off in Barcelona, without any single MySQL bug report opened for day.

I like this view of Barcelona way more than any MySQL bugs review, including this one.

To summarize:

  1. Oracle engineers who process bugs still sometimes do not care to check if all
    supported major versions are affected and/or share the results of such
    checks in public. Instead, some of them care to argue about severity of the bug report, test case details etc.
  2. We still see bug reports that originates from existing, well known MTR test cases runs under Valgrind or in debug builds with some non-default options set. I do not have any good reason in mind to explain why these are NOT reported by Oracle’s internal QA first.
  3. Surely some regression bugs still get verified without the regression tag added.

I truly hope my talk “Problems with Oracle’s Way of MySQL Bugs Database Maintenance” will be accepted for Percona Live Europe 2019 conference (at least as a lightning talk) and I’ll get another chance to speak about the problems highlighted above, and more. There are some “metabugs” in the way Oracle handles MySQL bug report, and these should be discussed and fixed, for the benefits of MySQL quality and all MySQL users and customers.

Auto-Scaling Clusters with Hazelcast Cloud

$
0
0

Feed: Blog – Hazelcast.
Author: Enes Akar.

As cloud technologies evolve, applications require less human intervention and maintenance. “Serverless” is a term that implies that users should have nothing to do with servers. The most exciting claim of serverless functions is that they scale automatically as the user base and load grows. Moreover, when there is no user activity, there will be no server or resource usage. But, serverless functions are not always the best solution. Many use cases require servers, such as web applications, databases, queues, etc. When you need servers, cloud instances, and VMs in your architecture, then auto-scaling technologies will be beneficial. Auto-scaling enables a cluster to scale up and down depending on the load and usage rate of resources. You benefit from auto-scaling in two areas: 

  • Better availability and service quality: Auto-scaling prevents outages and performance drops in case of a demand spike by increasing the resources and capacity of clusters.
  • Low cost: When the demand is low, auto-scaling decreases the size of the cluster. That means you do not pay more than you need when the demand is low.

In this instance, Hazelcast Cloud can act as a “Backend-as-a-Service” (BaaS). Under this approach, Hazelcast will maintain the clusters for you to provide a simplified experience without dealing with servers. Since auto-scaling is a critical component of Hazelcast Cloud, it can be used to scale your cluster without any human intervention.

Auto-Scaling Algorithm

Implementing auto-scaling for Hazelcast is straightforward. To grow a Hazelcast cluster, you need to add one more Hazelcast instance to the same network with the same credentials. The new node discovers and joins the cluster automatically. To shrink a cluster, terminate or shut down a node, and it will detect the dead node resulting in the partitions adjusting accordingly. Because multiple replicas of each partition are retained, no data is lost.

As scaling up and down with Hazelcast is quite easy, the only challenging part is to decide when to scale the cluster. The most popular use cases of Hazelcast are caching and data stores. For these use cases, memory is the primary resource that needs to be scaled, so we need auto-scaled, cloud-based Hazelcast clusters. Although the default metric used by Kubernetes’ horizontal autoscaler is CPU, we could customize it to check memory utilization instead of CPU. Unfortunately, this is not so simple. Hazelcast Cloud keeps user data in High-Density Memory Store (off-heap memory). Hazelcast reserves the off-heap memory beforehand, so the operating system can’t report what percentage of the cluster is free. Only Hazelcast knows how much data is being kept. To help, Hazelcast wrote an auto-scaling microservice that checks the actual memory utilization of the Hazelcast cluster and decides whether to scale. We call this microservice an “autoscaler.” As a simple algorithm, the Hazelcast autoscaler chooses to scale up (add one more node) when memory utilization is over 80%. When memory utilization drops below 40%, the autoscaler scales down the cluster by shutting down one node. To mitigate the side effects of repartitioning, the autoscaler sleeps for 1 minute after a scaling event. This means multiple-scale operations can take place with one-minute intervals between each. 

The above algorithm looks too simple, but we prefer it over more complicated algorithms because we do not expect rapid increases in memory utilization. The 40-80% rule works for most of the use cases and cluster types of Hazelcast Cloud. In the future, as more sophisticated use cases and requirements are experienced, Hazelcast will improve its auto-scaling algorithm, including potentially allowing users to adjust when and how to scale.

Auto-Scaling in Action

Let’s see how auto-scaling works step by step.

Step 1: Hazelcast Cloud Account – Hazelcast Cloud has a free tier. You can register for free without a credit card and start using Hazelcast clusters in for free with some restrictions. For example, the memory of a free cluster is fixed, so auto-scaling is not possible in the free tier. But don’t worry! To help you try auto-scaling, you can use the following code to get a $30 credit for free: auto_scaling_blog_30

If you don’t have one already, create a Hazelcast Cloud account here.  After confirming your email and login, go to Account >> Credits page and enter the promo code “auto_scaling_blog_30″ as below:

Step 2: Creating a Cluster – Now that you have $30 in credits, you have access to the full functionality of Hazelcast Cloud. To start, create a cluster with 4GB memory without enabling auto-scaling, as shown below:

Step 3: Insert Data – Now, you should have an active cluster with 4GB memory capacity, but empty. To insert data, click on “Configure Client” and follow the procedure for your preferred language. You will need to download the zip file and run the specified command in the same folder. The example below ran the sample Java client, which produced output similar to this:

As you see from the logs above, Hazelcast Cloud created a 4-node, 4GB cluster. Run the client to start inserting entries to a map, and you will see some statistics in the dashboard, similar to the metrics below:

Step 4: Enable Auto-Scaling – We began to add data, but still, the data size is quite small. I waited a few minutes because the entries that the client inserts are too small; yet, the cluster is almost empty. So 4GB is more than we need. Let’s enable auto-scaling by clicking on “Manage Memory,” and we should see Hazelcast Cloud scale down.

Managing Memory with Hazelcast Cloud

After clicking on “Update,” your cluster should scale down to 2GB step by step. First, it scales down to 3GB. In one minute, it rechecks the memory and scales down to 2GB. The minimum size of a small type cluster is 2GB; that’s why it does not attempt to scale down further.

Step 5: Insert More Data – We have tried scaling down. Now, let’s try scaling up. Our client example is very lazy, so we need to edit its code to put in larger objects at an accelerated pace. Here’s the updated code:     

Random random = new Random();
       int THREAD_COUNT = 10;
       int VALUE_SIZE = 1_000_000;
       ExecutorService es = Executors.newFixedThreadPool(THREAD_COUNT);
       for (int i = 0; i < THREAD_COUNT; i++) {
           es.submit(new Runnable() {
               public void run() {
                   while (true) {
                       int randomKey = (int) random.nextInt(1000_000_000);                                           
                       map.put("key" + randomKey, new String(new byte[VALUE_SIZE]));
                       // map.get("key" + random.nextInt(100_000));
                       if(randomKey % 10 == 0 ) {
                           System.out.println("map size:" + map.size());
                       }
                   }
               }
           });               
       }

Here are the changes I have made to increase insertion rate:

  1. Converted the insertion code to multithreaded (10 threads)
  2. Increased the value size to 1MB.
  3. Commented the get operation.
  4. Increased the range of keys to 1 million.

Then I started two clients. After waiting for a few minutes, you will see something similar to this:

As you can see, the cluster scaled up to 3GB when the data size exceeded 1.6GB. 

If you are anxious to see results quicker, you can create more clients or increase the number of threads for the insertion rate. The best way to maximize the throughput is to run the clients inside the same region with the Hazelcast cluster. When you run the client from your laptop, the network latency between your laptop and AWS instances becomes the bottleneck.

What’s Next

We have explained and experimented with the auto-scaling capability. This is the initial version, so we are working on improving auto-scaling via the following methods:

  • Support metrics other than memory, such as CPU and requests per second for triggering auto-scaling
  • Support user-defined metrics to trigger auto-scaling
  • Allow users to define the percentages to trigger auto-scaling

Build, secure, and manage data lakes with AWS Lake Formation

$
0
0

Feed: AWS Big Data Blog.

A data lake is a centralized store of a variety of data types for analysis by multiple analytics approaches and groups. Many organizations are moving their data into a data lake. In this post, I explore how you can use AWS Lake Formation to build, secure, and manage data lakes.

Traditionally, organizations have kept data in a rigid, single-purpose system, such as an on-premises data warehouse appliance. Similarly, they have analyzed data using a single method, such as predefined BI reports. Moving data between databases or for use with different approaches, like machine learning (ML) or improvised SQL querying, required “extract, transform, load” (ETL) processing before analysis. At best, these traditional methods have created inefficiencies and delays. At worst, they have complicated security.

By contrast, cloud-based data lakes open structured and unstructured data for more flexible analysis. Any amount of data can be aggregated, organized, prepared, and secured by IT staff in advance. Analysts and data scientists can then access it in place with the analytics tools of their choice, in compliance with appropriate usage policies.

Data lakes let you combine analytics methods, offering valuable insights unavailable through traditional data storage and analysis. In a retail scenario, ML methods discovered detailed customer profiles and cohorts on non-personally identifiable data gathered from web browsing behavior, purchase history, support records, and even social media. The exercise showed the deployment of ML models on real-time, streaming, interactive customer data.

Such models could analyze shopping baskets and serve up “next best offers” in the moment, or deliver instant promotional incentives. Marketing and support staff could explore customer profitability and satisfaction in real time and define new tactics to improve sales. Around a data lake, combined analytics techniques like these can unify diverse data streams, providing insights unobtainable from siloed data.

The challenges of building data lakes

Unfortunately, the complex and time-consuming process for building, securing, and starting to manage a data lake often takes months. Even building a data lake in the cloud requires many manual and time-consuming steps:

  • Setting up storage.
  • Moving, cleaning, preparing, and cataloging data.
  • Configuring and enforcing security policies for each service.
  • Manually granting access to users.

You want data lakes to centralize data for processing and analysis with multiple services. But organizing and securing the environment requires patience.

Currently, IT staff and architects spend too much time creating the data lake, configuring security, and responding to data requests. They could spend this time acting as curators of data resources, or as advisors to analysts and data scientists. Analysts and data scientists must wait for access to needed data throughout the setup.

The following diagram shows the data lake setup process:

Setting up storage

Data lakes hold massive amounts of data. Before doing anything else, you must set up storage to hold all that data. If you are using AWS, configure Amazon S3 buckets and partitions. If you are building the data lake on premises, acquire hardware and set up large disk arrays to store all the data.

Moving data

Connect to different data sources — on-premises and in the cloud — then collect data on IoT devices. Next, collect and organize the relevant datasets from those sources, crawl the data to extract the schemas, and add metadata tags to the catalog. You can use a collection of file transfer and ETL tools:

Cleaning and preparing data

Next, collected data must be carefully partitioned, indexed, and transformed to columnar formats to optimize for performance and cost. You must clean, de-duplicate, and match related records.

Today, organizations accomplish these tasks using rigid and complex SQL statements that perform unreliably and are difficult to maintain. This complex process of collecting, cleaning, and transforming the incoming data requires manual monitoring to avoid errors. Many customers use AWS Glue for this task.

Configuring and enforcing policies

Customers and regulators require that organizations secure sensitive data. Compliance involves creating and applying data access, protection, and compliance policies. For example, you restrict access to personally identifiable information (PII) at the table, column, or row level, encrypt all data, and keep audit logs of who is accessing the data.

Today, you can secure data using access control lists on S3 buckets or third-party encryption and access control software. You create and maintain data access, protection, and compliance policies for each analytics service requiring access to the data. For example, if you are running analysis against your data lake using Amazon Redshift and Amazon Athena, you must set up access control rules for each of these services.

Many customers use AWS Glue Data Catalog resource policies to configure and control metadata access to their data. Some choose to use Apache Ranger. But these approaches can be painful and limiting. S3 policies provide at best table-level access. And you must maintain data and metadata policies separately. With Apache Ranger, you can configure metadata access to only one cluster at a time. Also, policies can become wordy as the number of users and teams accessing the data lake grows within an organization.

Making it easy to find data

Users with different needs, like analysts and data scientists, may struggle to find and trust relevant datasets in the data lake. To make it easy for users to find relevant and trusted data, you must clearly label the data in a data lake catalog. Provide users with the ability to access and analyze this data without making requests to IT.

Today, each of these steps involves a lot of manual work. Customer labor includes building data access and transformation workflows, mapping security and policy settings, and configuring tools and services for data movement, storage, cataloging, security, analytics, and ML. With all these steps, a fully productive data lake can take months to implement.

The wide range of AWS services provides all the building blocks of a data lake, including many choices for storage, computing, analytics, and security. In the nearly 13 years that AWS has been operating Amazon S3 with exabytes of data, it’s also become the clear first choice for data lakes. AWS Glue adds a data catalog and server-less transformation capabilities. Amazon EMR brings managed big data processing frameworks like Apache Spark and Apache Hadoop. Amazon Redshift Spectrum offers data warehouse functions directly on data in Amazon S3. Athena brings server-less SQL querying.

With all these services available, customers have been building data lakes on AWS for years. AWS runs over 10,000 data lakes on top of S3, many using AWS Glue for the shared AWS Glue Data Catalog and data processing with Apache Spark.

AWS has learned from the thousands of customers running analytics on AWS that most customers who want to do analytics also want to build a data lake. But many of you want this process to be easier and faster than it is today.

AWS Lake Formation (now generally available)

At AWS re:Invent 2018, AWS introduced Lake Formation: a new managed service to help you build a secure data lake in days. If you missed it, watch Andy Jassy’s keynote announcement. Lake Formation has several advantages:

  • Identify, ingest, clean, and transform data: With Lake Formation, you can move, store, catalog, and clean your data faster.
  • Enforce security policies across multiple services: After your data sources are set up, you then define security, governance, and auditing policies in one place, and enforce those policies for all users and all applications.
  • Gain and manage new insights:With Lake Formation, you build a data catalog that describes available datasets and their appropriate business uses. This catalog makes your users more productive by helping them find the right dataset to analyze.

The following screenshot illustrates Lake Formation and its capabilities.

How to create a data lake

S3 forms the storage layer for Lake Formation. If you already use S3, you typically begin by registering existing S3 buckets that contain your data. Lake Formation creates new buckets for the data lake and import data into them. AWS always stores this data in your account, and only you have direct access to it.

There is no lock-in to Lake Formation for your data. Because AWS stores data in standard formats like CSV, ORC, or Parquet, it can be used with a wide variety of AWS or third-party analytics tools.

Lake Formation also optimizes the partitioning of data in S3 to improve performance and reduce costs. The raw data you load may reside in partitions that are too small (requiring extra reads) or too large (reading more data than needed). Lake Formation organizes your data by size, time, or relevant keys to allow fast scans and parallel, distributed reads for the most commonly used queries.

How to load data and catalog metadata

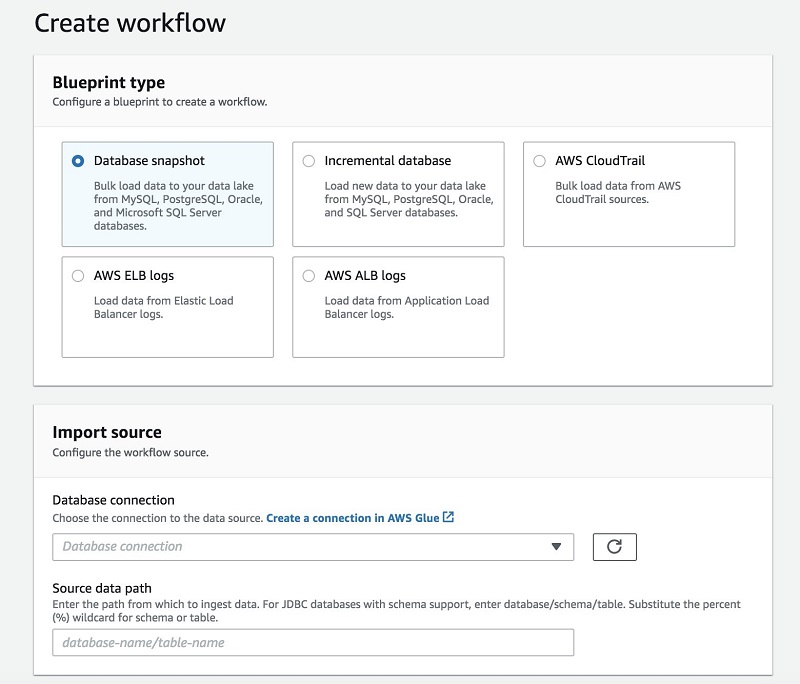
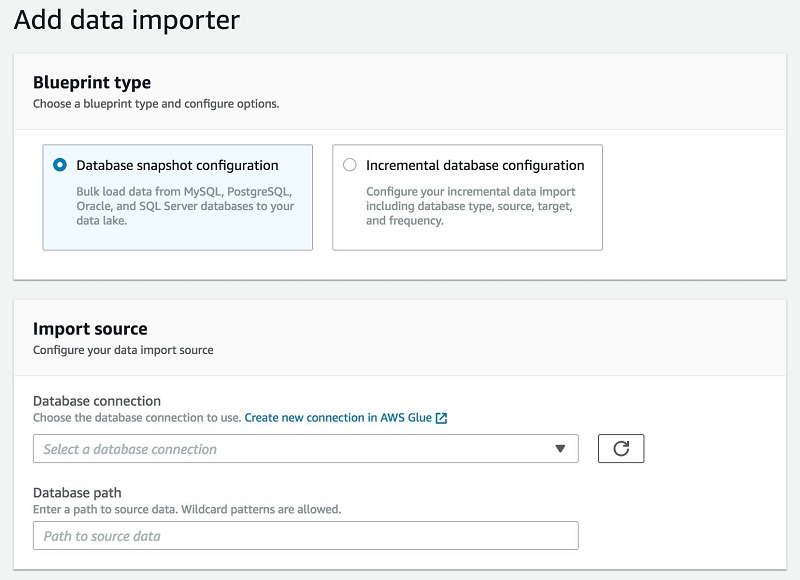
Lake Formation uses the concept of blueprints for loading and cataloging data. You can run blueprints one time for an initial load or set them up to be incremental, adding new data and making it available.

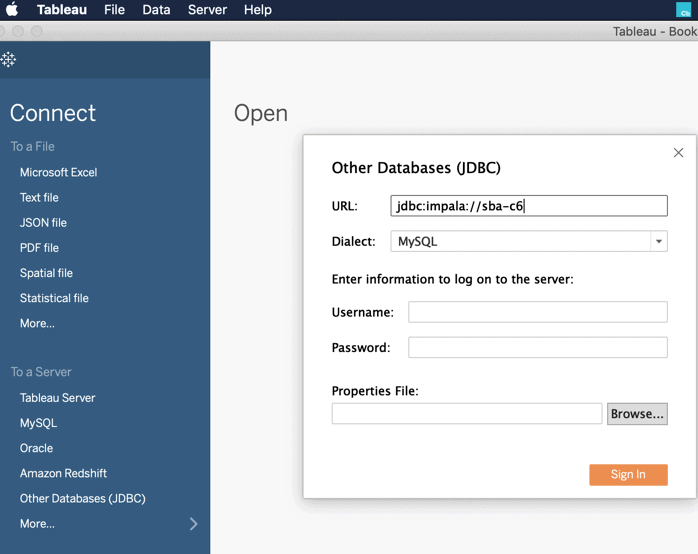
With Lake Formation, you can import data from MySQL, Postgres, SQL Server, MariaDB, and Oracle databases running in Amazon RDS or hosted in Amazon EC2. You can also import from on-premises databases by connecting with Java Database Connectivity (JDBC).

Point Lake Formation to the data source, identify the location to load it into the data lake, and specify how often to load it. Blueprints discovers the source table schema, automatically convert data to the target data format, partition the data based on the partitioning schema, and track data that was already processed. All these actions can be customized.

Blueprints rely on AWS Glue as a support service. AWS Glue crawlers connect and discover the raw data that to be ingested. AWS Glue code generation and jobs generate the ingest code to bring that data into the data lake. Lake Formation uses the same data catalog for organizing the metadata. AWS Glue stitches together crawlers and jobs and allows for monitoring for individual workflows. In these ways, Lake Formation is a natural extension of AWS Glue capabilities.

The following graphics show the Blueprint Workflow and Import screens:

How to transform and prepare data for analysis

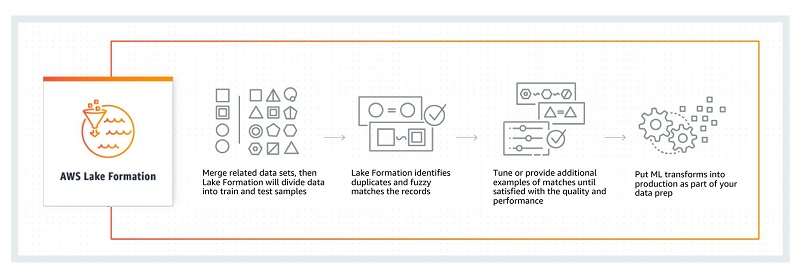
In addition to supporting all the same ETL capabilities as AWS Glue, Lake Formation introduces new Amazon ML Transforms. This feature includes a fuzzy logic blocking algorithm that can de-duplicate 400M+ records in less than 2.5 hours, which is magnitudes better than earlier approaches.

To match and de-duplicate your data using Amazon ML Transforms: First, merge related datasets. Amazon ML Transforms divides these sets into training and testing samples, then scans for exact and fuzzy matches. You can provide more data and examples for greater accuracy, putting these into production to process new data as it arrives to your data lake. The partitioning algorithm requires minimal tuning. The confidence level reflects the quality of the grouping, improving on earlier, more improvised algorithms. The following diagram shows this matching and de-duplicating workflow.

Amazon.com is currently using and vetting Amazon ML Transforms internally, at scale, for retail workloads. Lake Formation now makes these algorithms available to customers, so you can avoid the frustration of creating complex and fragile SQL statements to handle record matching and de-duplication. Amazon ML Transforms help improve data quality before analysis. For more information, see Fuzzy Matching and Deduplicating Data with Amazon ML Transforms for AWS Lake Formation.

How to set access control permissions

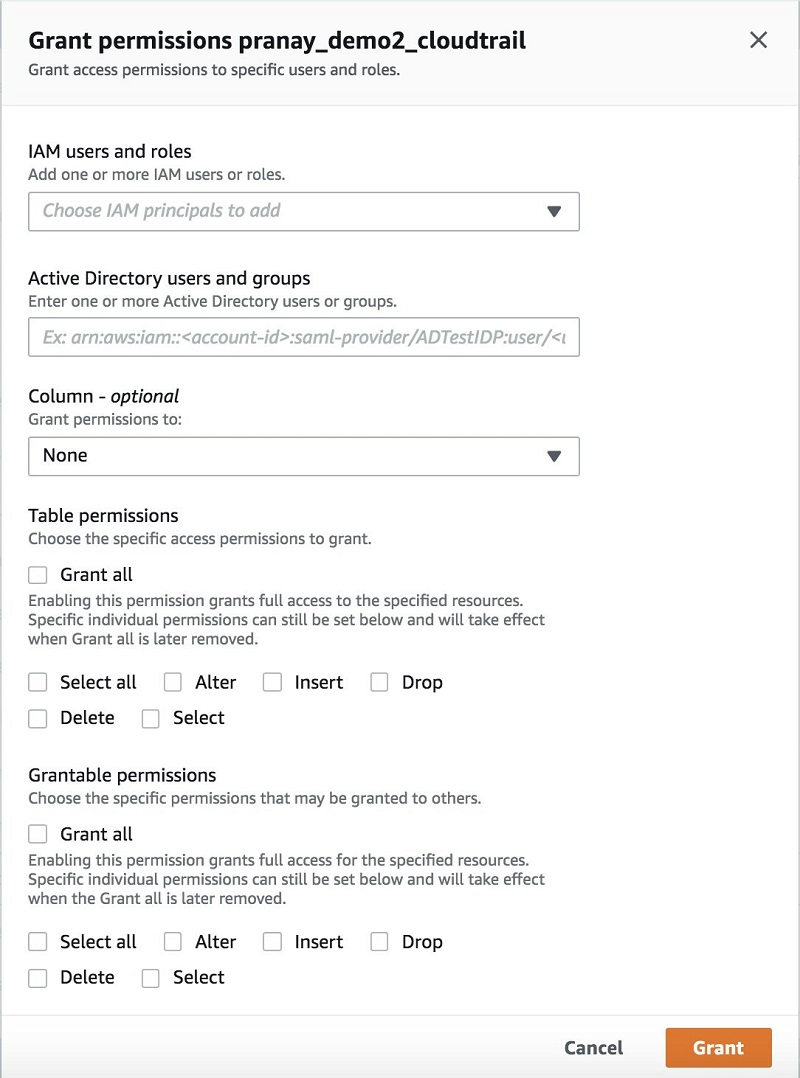
Lake Formation lets you define policies and control data access with simple “grant and revoke permissions to data” sets at granular levels. You can assign permissions to IAM users, roles, groups, and Active Directory users using federation. You specify permissions on catalog objects (like tables and columns) rather than on buckets and objects.

You can easily view and audit all the data policies granted to a user—in one place. Search and view the permissions granted to a user, role, or group through the dashboard; verify permissions granted; and when necessary, easily revoke policies for a user. The following screenshots show the Grant permissions console:

How to make data available for analytics

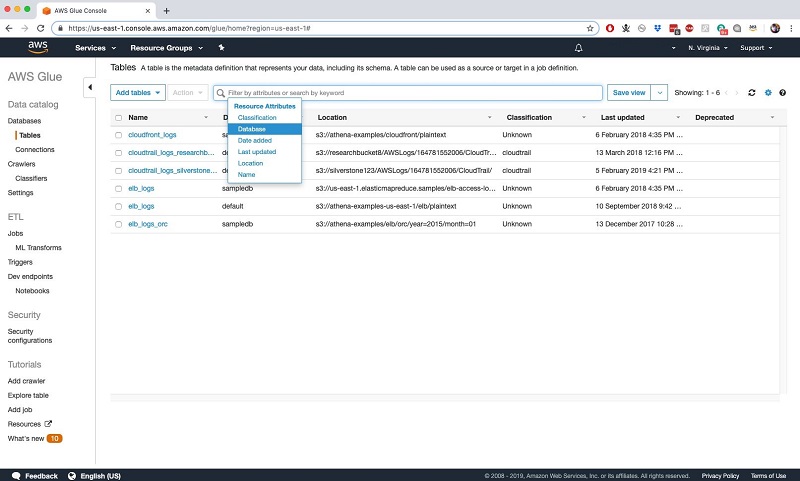
Lake Formation offers unified, text-based, faceted search across all metadata, giving users self-serve access to the catalog of datasets available for analysis. This catalog includes discovered schemas (as discussed previously) and lets you add attributes like data owners, stewards, and other business-specific attributes as table properties.

At a more granular level, you can also add data sensitivity level, column definitions, and other attributes as column properties. You can explore data by any of these properties. But access is subject to user permissions. See the following screenshot of the AWS Glue tables tab:

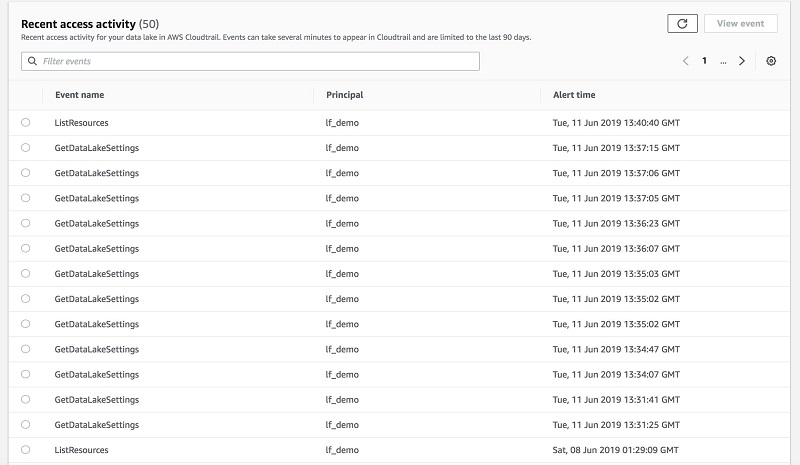
How to monitor activity

With Lake Formation, you can also see detailed alerts in the dashboard, and then download audit logs for further analytics.

Amazon CloudWatch publishes all data ingestion events and catalog notifications. In this way, you can identify suspicious behavior or demonstrate compliance with rules.

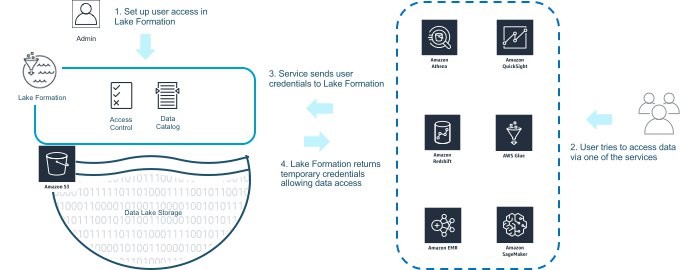
To monitor and control access using Lake Formation, first define the access policies, as described previously. Users who want to conduct analysis access data directly through an AWS analytics service, such as Amazon EMR for Spark, Amazon Redshift, or Athena. Or, they access data indirectly with Amazon QuickSight or Amazon SageMaker.

A service forwards the user credentials to Lake Formation for the validation of access permissions. Then Lake Formation returns temporary credentials granting access to the data in S3, as shown in the following diagrams. After a user gains access, actual reads and writes of data operate directly between the analytics service and S3. This approach removes the need for an intermediary in the critical data-processing path.

The following screenshot and diagram show how to monitor and control access using Lake Formation.

Conclusion

With just a few steps, you can set up your data lake on S3 and start ingesting data that is readily queryable. To get started, go to the Lake Formation console and add your data sources. Lake Formation crawls those sources and moves the data into your new S3 data lake.

Lake Formation can automatically lay out the data in S3 partitions; change it into formats for faster analytics, like Apache Parquet and ORC; and increase data quality through machine-learned record matching and de-duplication.

From a single dashboard, you can set up all the permissions for your data lake. Those permissions are implemented for every service accessing this data – including analytics and ML services (Amazon Redshift, Athena, and Amazon EMR for Apache Spark workloads). Lake Formation saves you the hassle of redefining policies across multiple services and provides consistent enforcement of and compliance with those policies.

Learn how to start using AWS Lake Formation.


About the Authors

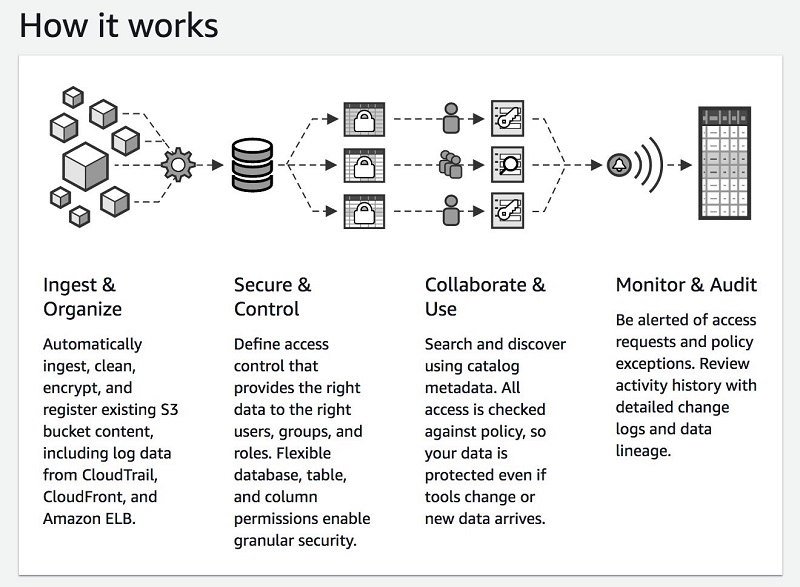
Nikki Rouda is the principal product marketing manager for data lakes and big data at AWS. Nikki has spent 20+ years helping enterprises in 40+ countries develop and implement solutions to their analytics and IT infrastructure challenges. Nikki holds an MBA from the University of Cambridge and an ScB in geophysics and math from Brown University.

Prajakta Damle is a Principle Product Manager at Amazon Web Services.

AWS Lake Formation is now generally available

$
0
0

Feed: Recent Announcements.

However, setting up and managing data lakes today involves a lot of manual, complicated, and time-consuming tasks. This work includes loading data from diverse sources, monitoring those data flows, setting up partitions, turning on encryption and managing keys, defining transformation jobs and monitoring their operation, re-organizing data into a columnar format, configuring access control settings, using machine learning to identify approximate duplicates and matching records across data sets, granting access to data sets, and auditing access over time. 

Creating a data lake with AWS Lake Formation is as simple as defining where your data resides and what data access and security policies you want to apply. AWS Lake Formation then collects and catalogs data from databases and object storage, moves the data into your new Amazon S3 data lake, cleans and classifies data using machine learning algorithms, and secures access to your sensitive data. Your users can then access a centralized catalog of data which describes available data sets and their appropriate usage. Your users then leverage these data sets with their choice of analytics and machine learning services, like Amazon EMR for Apache Spark, Amazon Redshift Spectrum, and Amazon Athena. 

AWS Lake Formation is available in the US East (Northern Virginia), US East (Ohio), US West (Oregon), EU (Ireland), and Asia Pacific (Tokyo) AWS regions. To see all the regions AWS Lake Formation is available in, visit the AWS Region page. Get started with AWS Lake Formation by visiting the AWS Lake Formation console

Viewing all 413 articles
Browse latest View live